Fig. 5
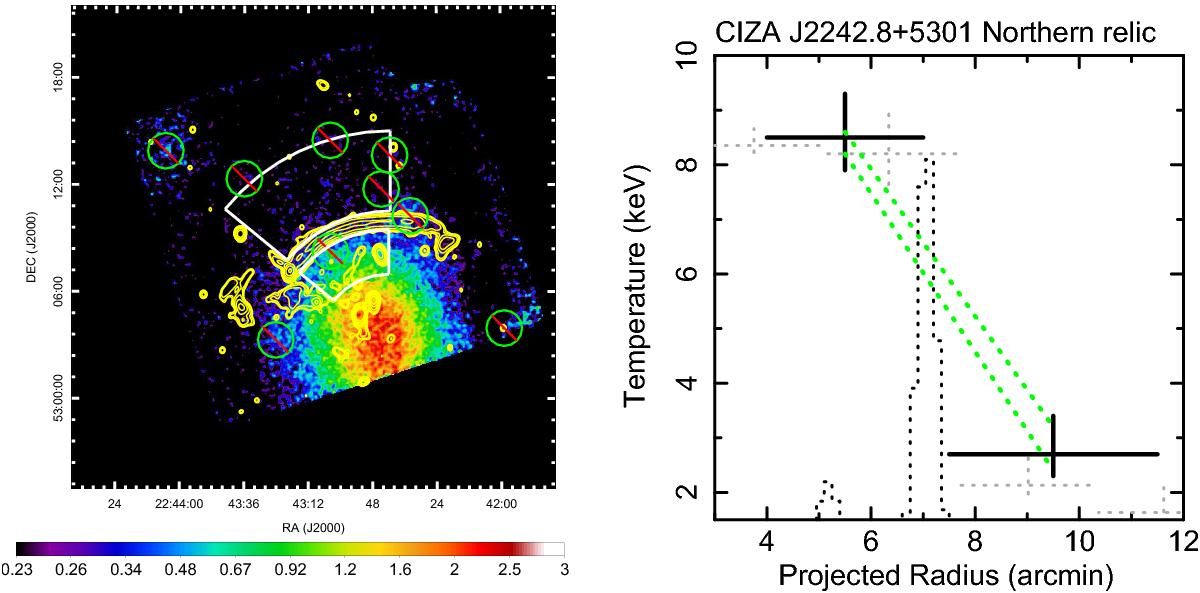
Left: Suzaku XIS image for the northern part of CIZA J2242.8+5301. Right: radial profile of the ICM temperature for the north direction. The present best-fit values with statistical errors are shown with black crosses. Gray dotted crosses indicate previous Suzaku results, which do not include HF component (Akamatsu & Kawahara 2013). The range of uncertainties due to the combined 3% variation of the NXB level and the maximum/minimum fluctuation in the CXB is shown with two green dashed lines. The black dotted lines show the WSRT 1.4 GHz radio intensity scaled arbitrary in flux. The higher peak corresponds the northern radio relic and the second peak is a point source just behind the radio relic.
Current usage metrics show cumulative count of Article Views (full-text article views including HTML views, PDF and ePub downloads, according to the available data) and Abstracts Views on Vision4Press platform.
Data correspond to usage on the plateform after 2015. The current usage metrics is available 48-96 hours after online publication and is updated daily on week days.
Initial download of the metrics may take a while.