Fig. 4
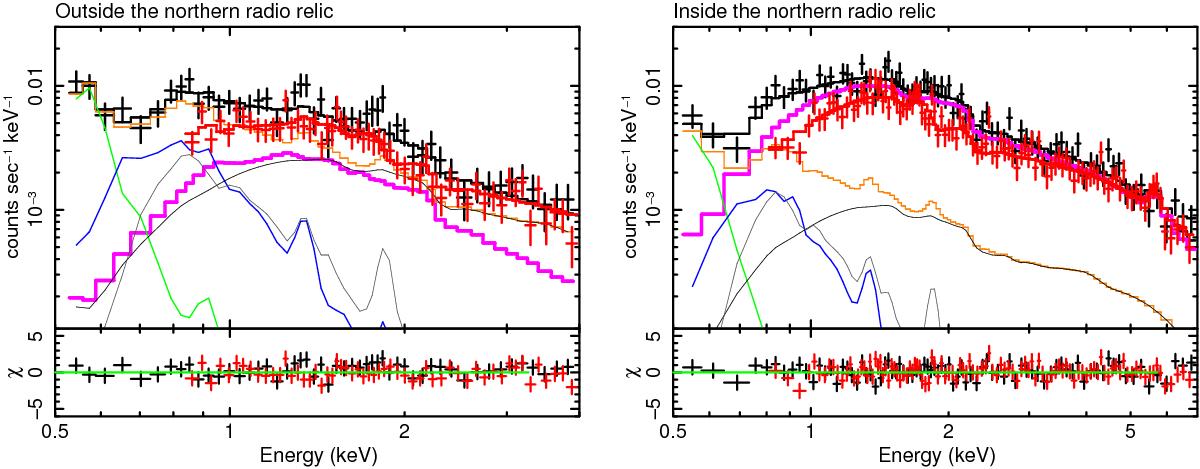
NXB subtracted spectra in each annular region. The XIS BI (Black) and FI (Red) spectra are fitted with the ICM model (phabs × apec), along with the sum of the CXB and the Galactic emission of Case 2 (apec + phabs(apec + apec + powerlaw)). The ICM component is shown with a magenta line. The CXB component is shown with a black curve, and the LHB, MWH, and HF emissions are indicated with green, blue and gray curves, respectively. The sum of all sky background components is shown with the orange curve. The left panel shows the spectrum of the outside region. The right panel shows the inside region.
Current usage metrics show cumulative count of Article Views (full-text article views including HTML views, PDF and ePub downloads, according to the available data) and Abstracts Views on Vision4Press platform.
Data correspond to usage on the plateform after 2015. The current usage metrics is available 48-96 hours after online publication and is updated daily on week days.
Initial download of the metrics may take a while.