Fig. 3
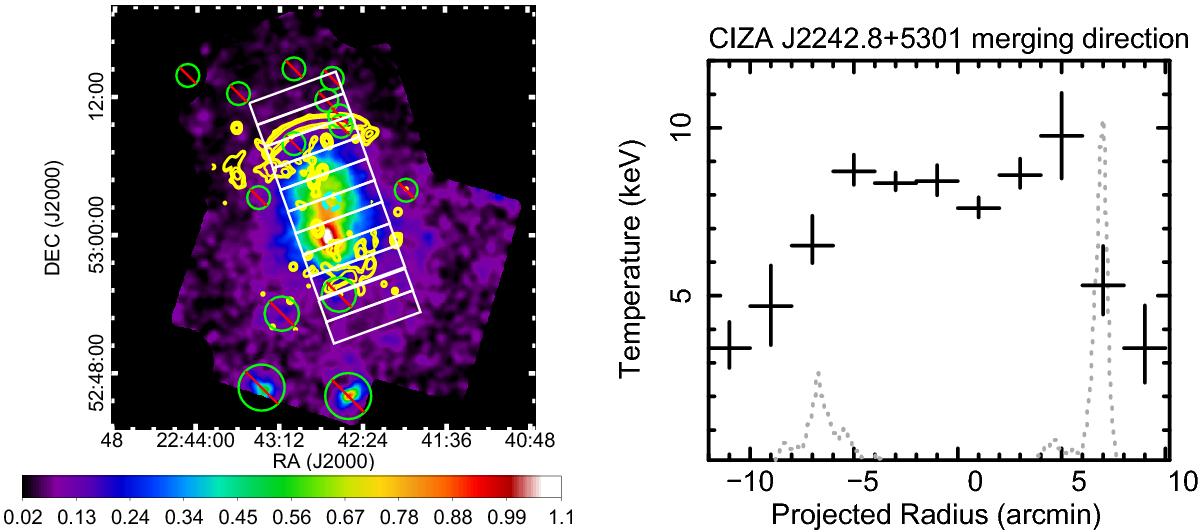
Left: X-ray image of the CIZA J2242.8+5301 in the energy band 0.5−5.0 keV, after subtraction of the NXB with no vignetting correction and after smoothing by a two dimensional Gaussian with σ = 8 pixel = 8.5′′. The identified point sources by XMM-Newton are highlighted with the green circles (see text). The 1.4 GHz radio emission is shown with yellow contours. The dashed cyan circle indicate the center which, was determined by visually fitting a circle to the radio relics. Right: temperature profile of CIZA J2242.8+5301 from the south to north direction. The dotted gray lines show WSRT 1.4 GHz radio emission.
Current usage metrics show cumulative count of Article Views (full-text article views including HTML views, PDF and ePub downloads, according to the available data) and Abstracts Views on Vision4Press platform.
Data correspond to usage on the plateform after 2015. The current usage metrics is available 48-96 hours after online publication and is updated daily on week days.
Initial download of the metrics may take a while.