Fig. 9
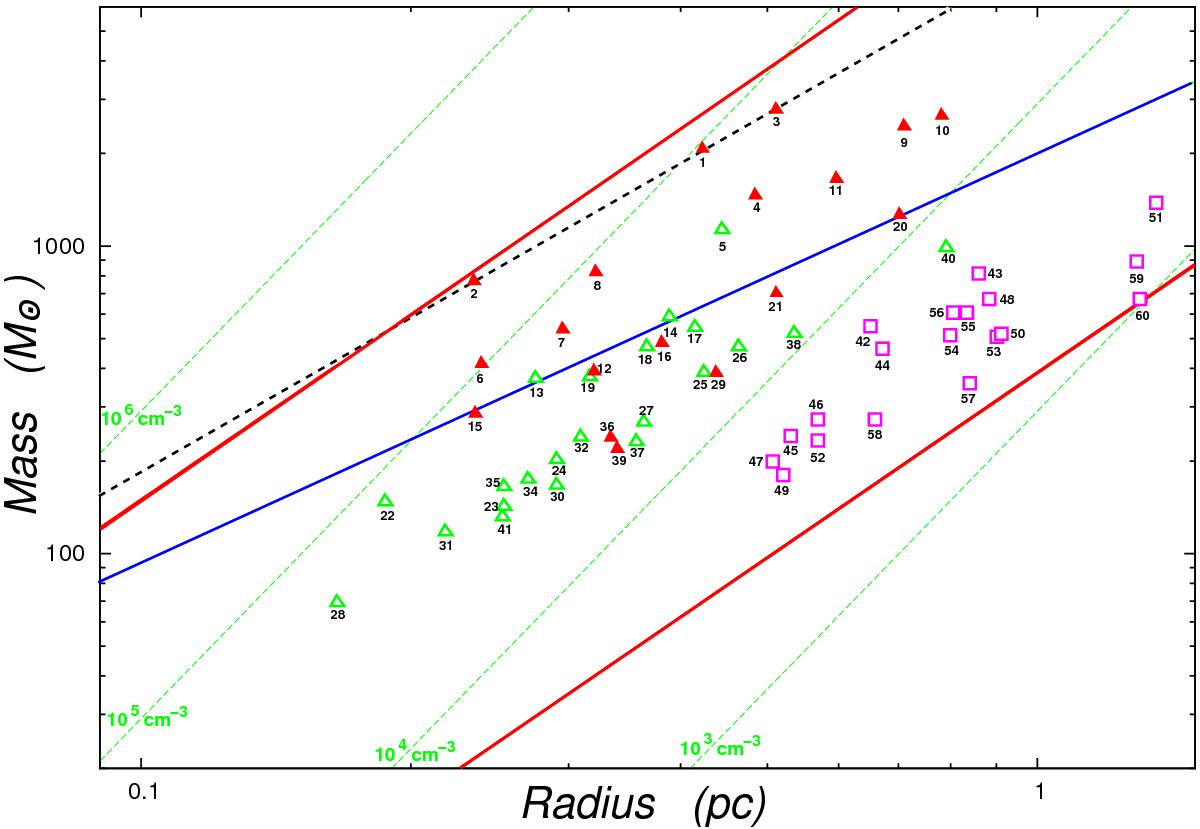
Mass-radius relationship. Filled red traingles indicate 870 μm clumps with candidate YSOs projected inside the limits determined by Gaussclumps, while green open triangles indicate 870 μm starless clumps. Magenta open squares indicate the 250 μm clumps. The blue solid line shows the scaled mass-radius threshold for high-mass star formation determined by Kauffmann & Pillai (2010). The rescaled mass-radius relationship derived by Urquhart et al. (2013) is shown by the dotted black line. Upper and lower solid red lines show surface densities of 1 g cm-2 and 0.024 g cm-2, respectively. Dotted green lines indicate volume densities at 103 cm-3, 104 cm-3, 105 cm-3 , and 106 cm-3.
Current usage metrics show cumulative count of Article Views (full-text article views including HTML views, PDF and ePub downloads, according to the available data) and Abstracts Views on Vision4Press platform.
Data correspond to usage on the plateform after 2015. The current usage metrics is available 48-96 hours after online publication and is updated daily on week days.
Initial download of the metrics may take a while.