Free Access
Fig. 7
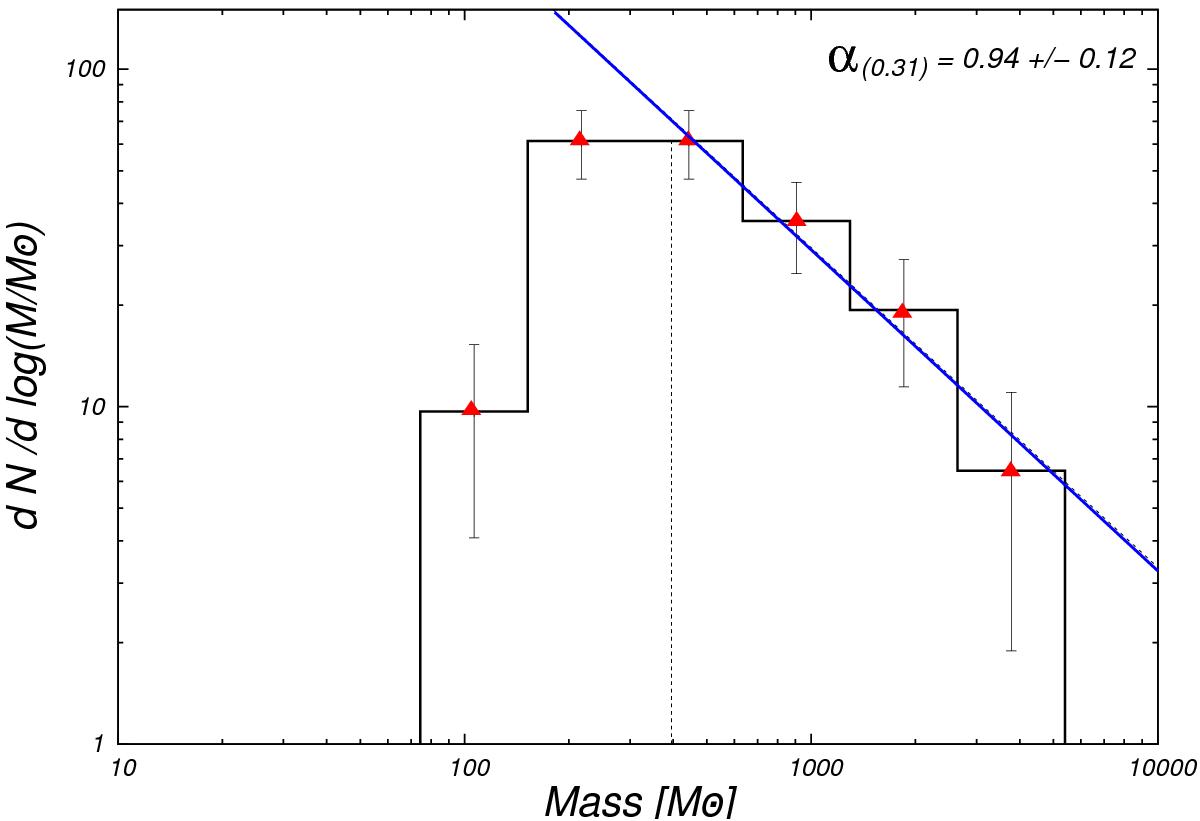
Example of a CMD for Δlog (M/M⊙) = 0.31. Red triangles represent the central mass of each bin and error bars represent the standard deviation of a Poisson distribution (![]() ). Blue lines represent the best fit above the 400 M⊙ limit (dotted vertical line).
). Blue lines represent the best fit above the 400 M⊙ limit (dotted vertical line).
Current usage metrics show cumulative count of Article Views (full-text article views including HTML views, PDF and ePub downloads, according to the available data) and Abstracts Views on Vision4Press platform.
Data correspond to usage on the plateform after 2015. The current usage metrics is available 48-96 hours after online publication and is updated daily on week days.
Initial download of the metrics may take a while.