Fig. 6
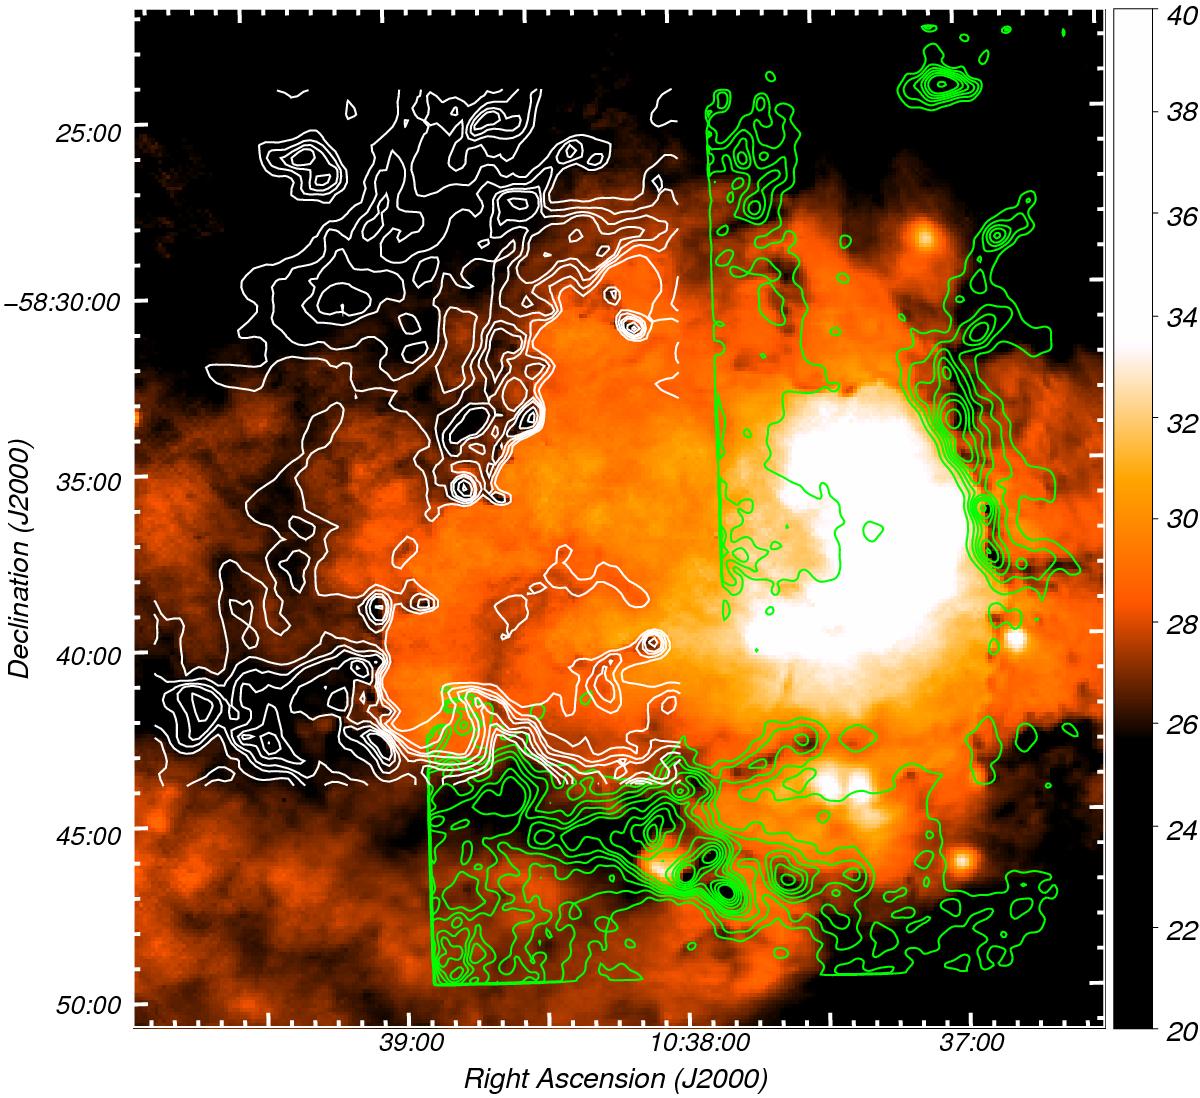
Dust temperature map (in color scale) derived from Herschel emission at 70 and 160 μm. The color-temperature scale is on the right. The 870 μm emission is shown in green contours and the 250 μm emission is shown in white contours. The 870 μm contours are the same as in Fig. 1 and the 250 μm contours go from 410 mJy beam-1 (~4σ) to 590 mJy beam-1 in steps of 50 mJy beam-1, and from 700 mJy beam-1 in steps of 100 mJy beam-1.
Current usage metrics show cumulative count of Article Views (full-text article views including HTML views, PDF and ePub downloads, according to the available data) and Abstracts Views on Vision4Press platform.
Data correspond to usage on the plateform after 2015. The current usage metrics is available 48-96 hours after online publication and is updated daily on week days.
Initial download of the metrics may take a while.