Fig. 3
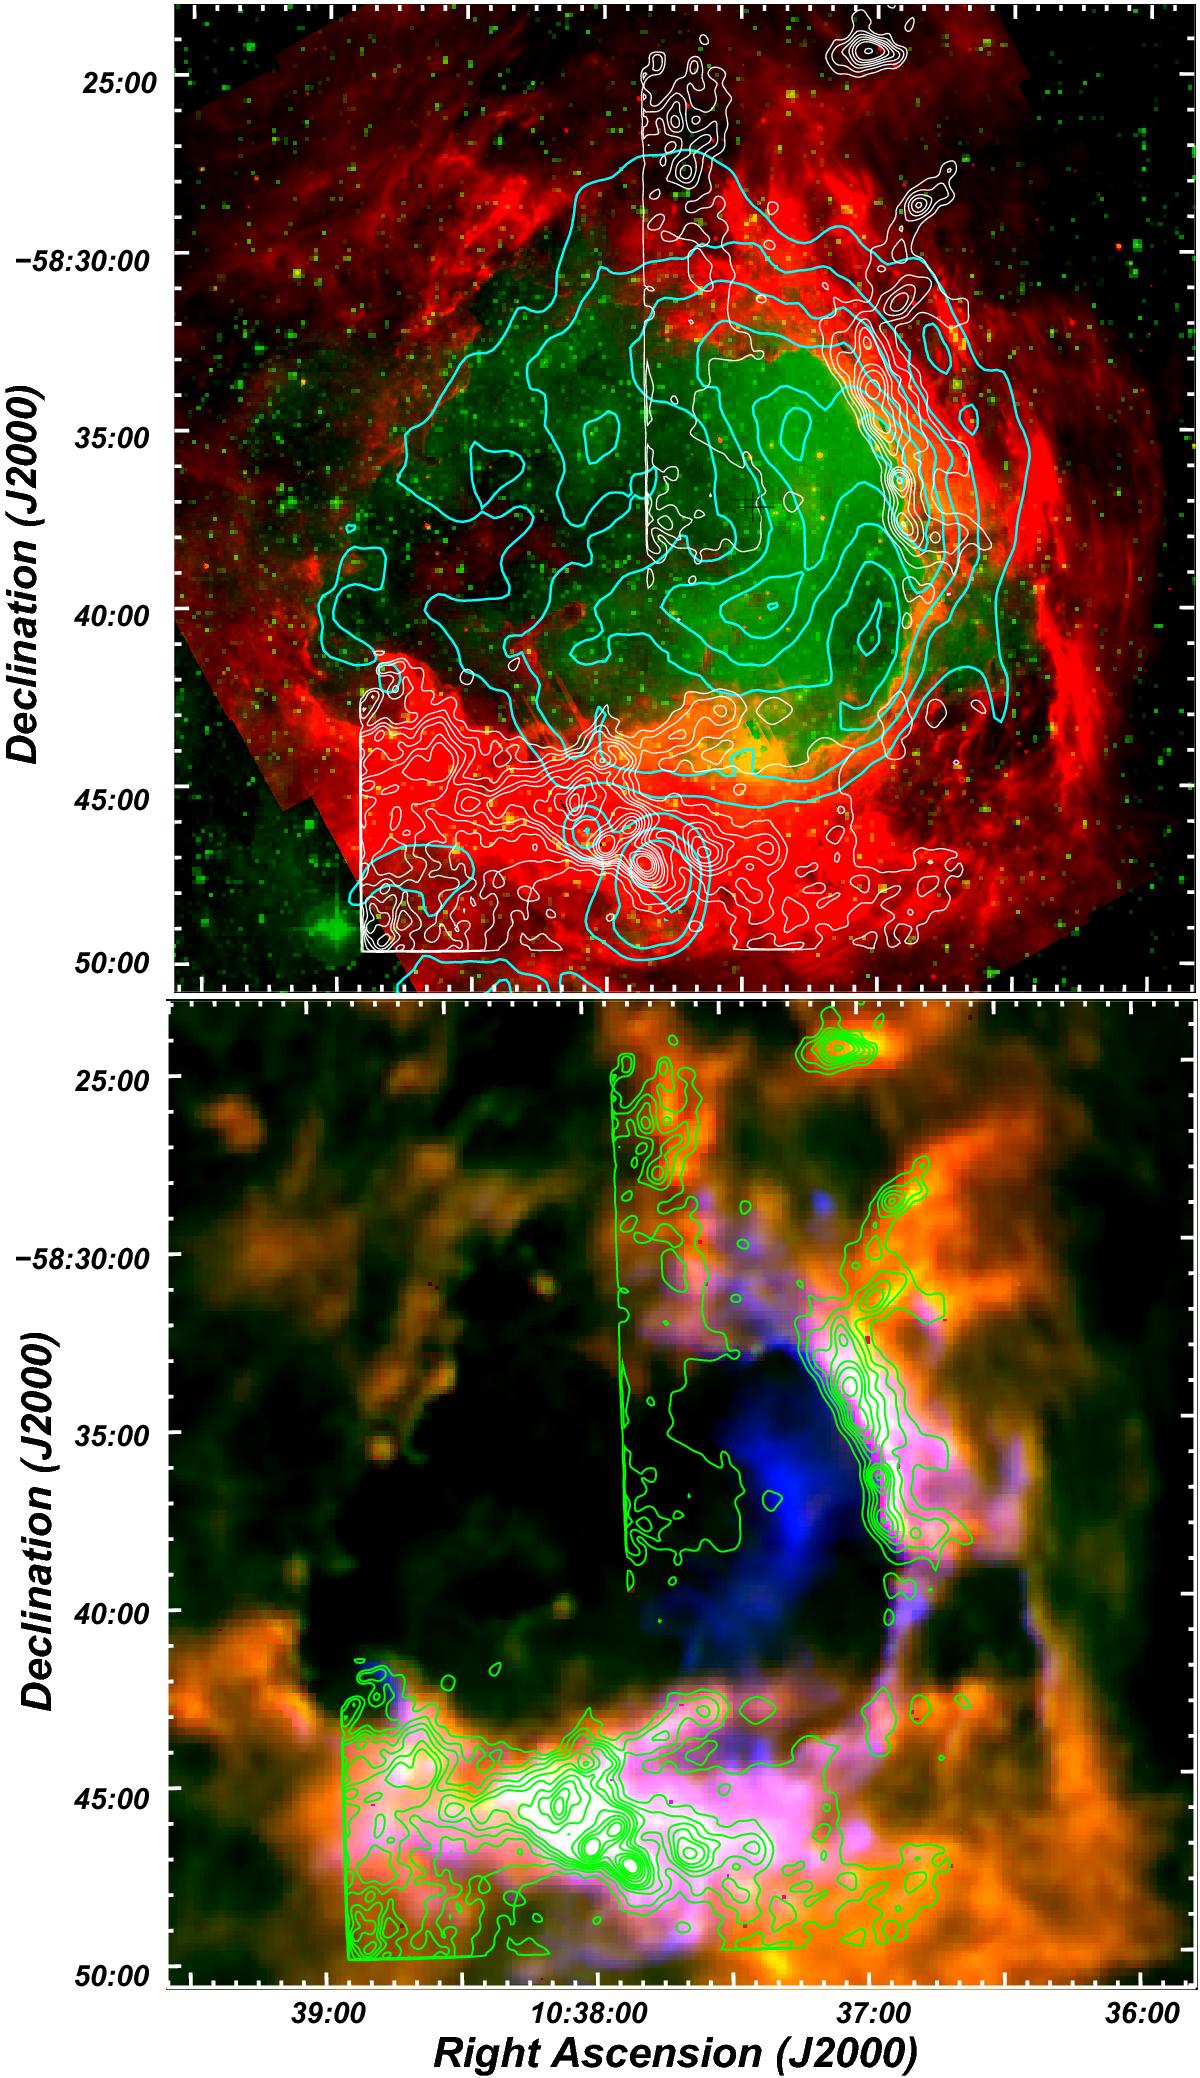
Upper panel: composite image of Gum 31 and its environs. The IRAC-GLIMPSE emission at 8.0 μm is shown in red, while green indicates the DSSR2 optical emission (red plate). White contours show the 870 μm emission while cyan contours shows the radio continuum emission at 843 MHz. Black crosses at the center show the position of stars HD 92206A, B, and C. Lower panel: composite image of the 870 μm dust continuum emission (green contours) overlaid onto the Herschel 70 μm (blue), 250 μm (green), and 500 μm (red) emissions. The contours corresponding to the 870 μm emission in both panels are the same as in Fig. 1.
Current usage metrics show cumulative count of Article Views (full-text article views including HTML views, PDF and ePub downloads, according to the available data) and Abstracts Views on Vision4Press platform.
Data correspond to usage on the plateform after 2015. The current usage metrics is available 48-96 hours after online publication and is updated daily on week days.
Initial download of the metrics may take a while.