Free Access
Fig. 10
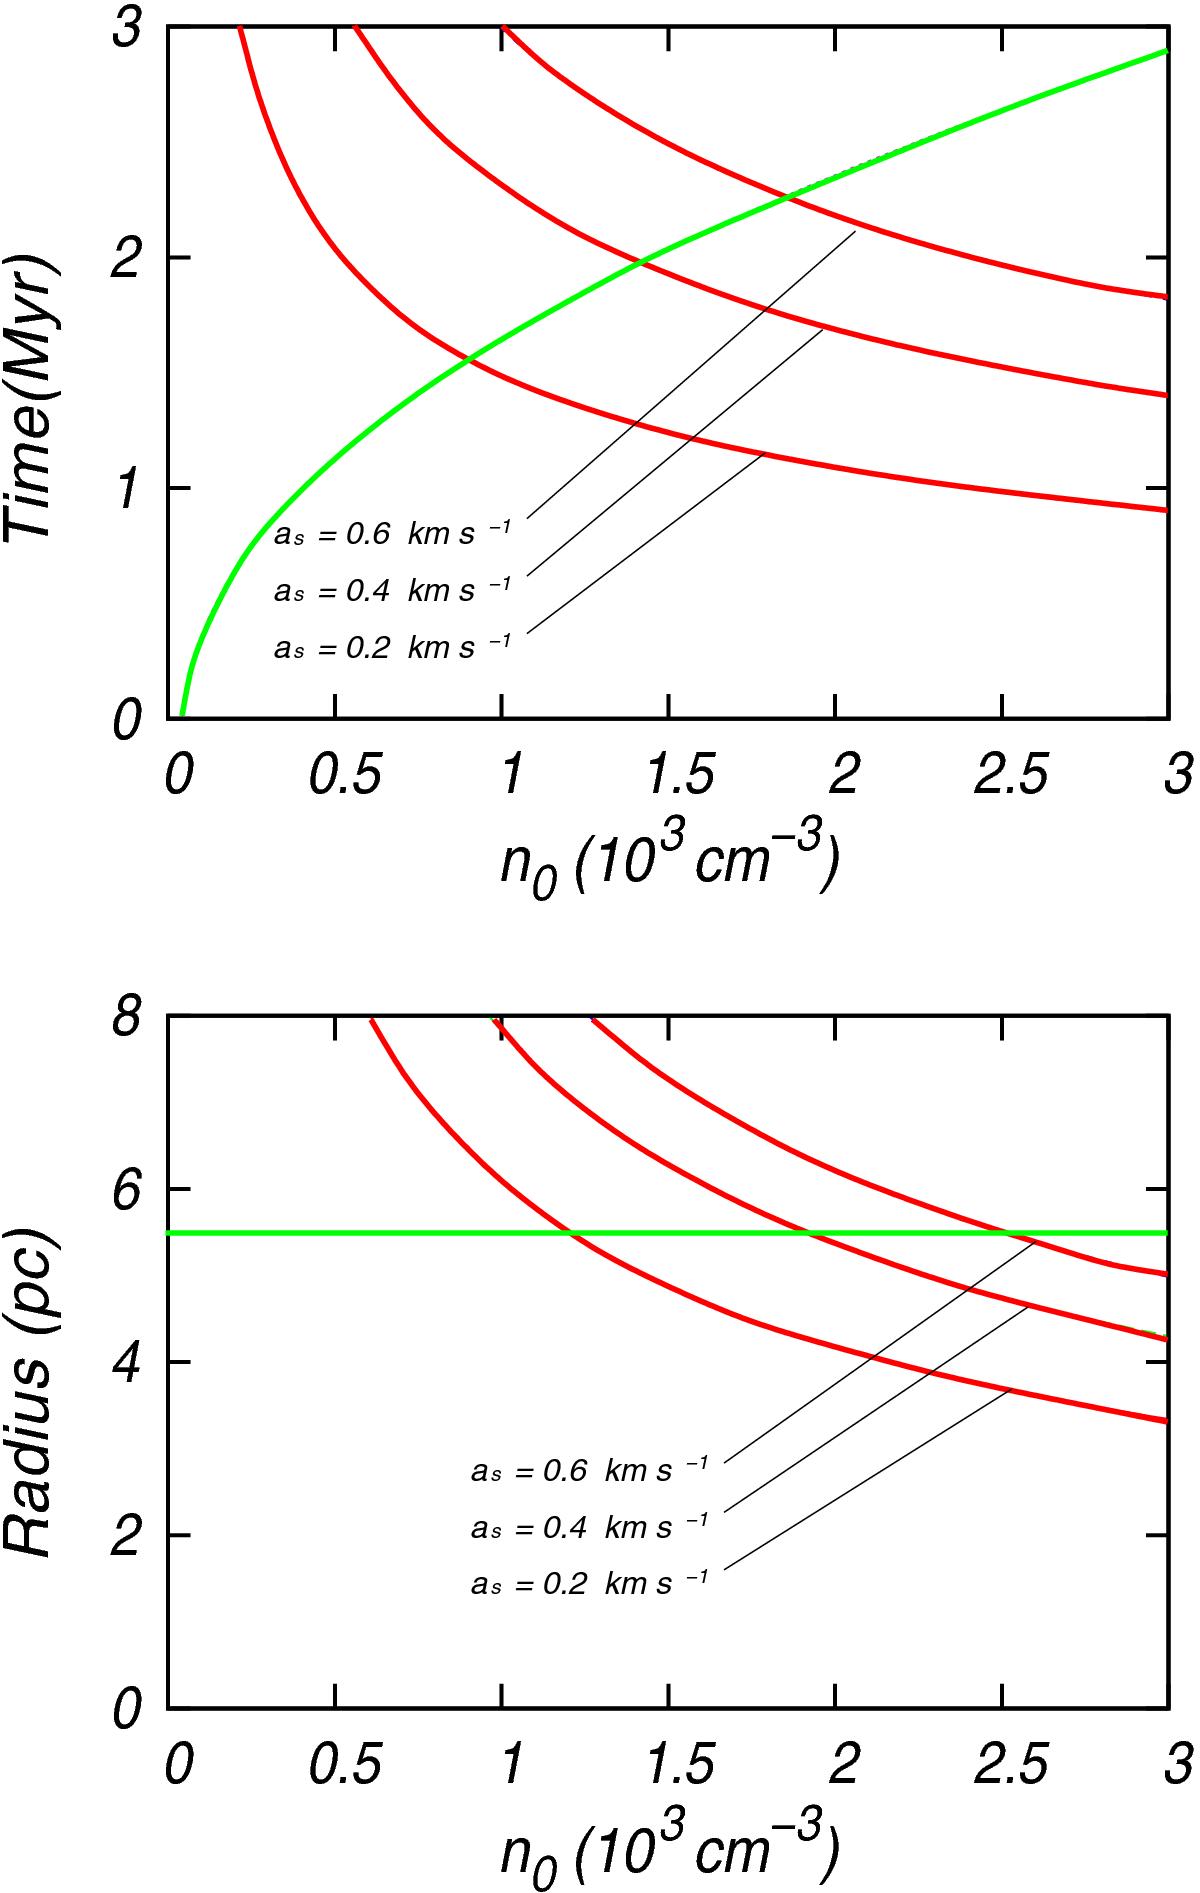
Upper panel: fragmentation time (red curves) and dynamical time (green curve), for R = 5.5 pc as a function of n0 = 0.2, 0.4, and 0.6 km s-1. Lower panel: radius of fragmentation as a function of n0 for the same values than in the upper panel (red curves). The green curve represents the radius of the Hii region (5.5 pc).
Current usage metrics show cumulative count of Article Views (full-text article views including HTML views, PDF and ePub downloads, according to the available data) and Abstracts Views on Vision4Press platform.
Data correspond to usage on the plateform after 2015. The current usage metrics is available 48-96 hours after online publication and is updated daily on week days.
Initial download of the metrics may take a while.