Fig. 5
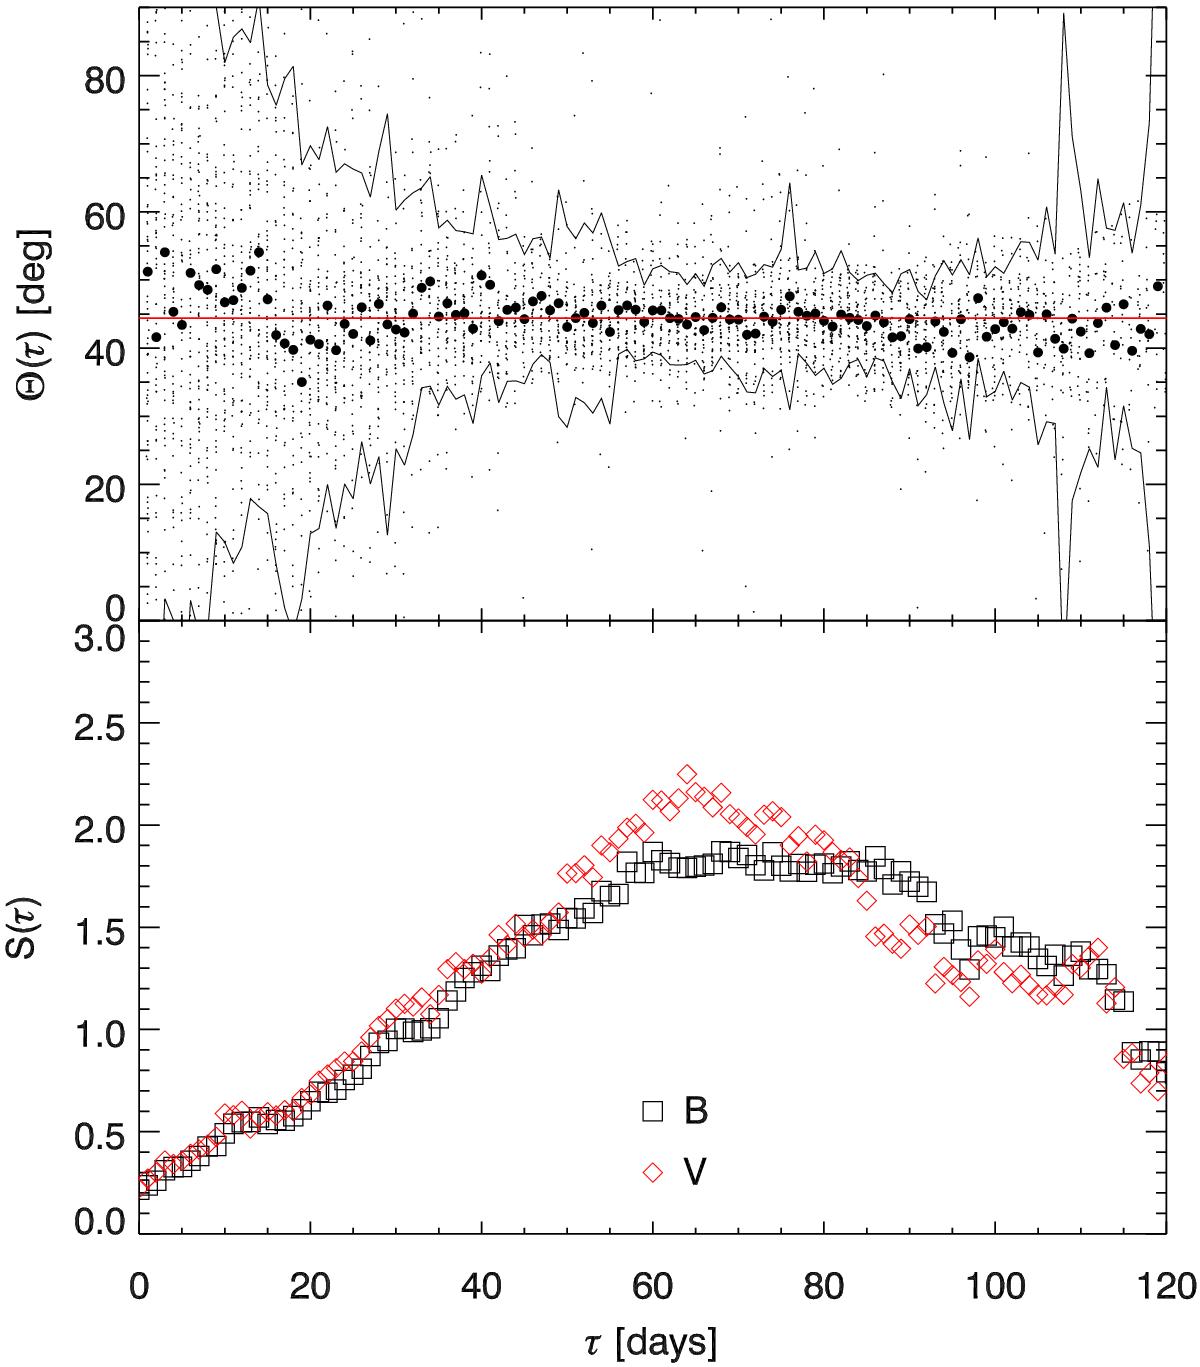
Top: small dots represent ![]() between all possible permutations of
measurements i,j with τ = |
tj −
ti |. Larger
dots mark the averages inside a bin of one day with their uncertainty plotted as a
continuous black line. The red straight line at 44.4° corresponds to the linear fit of
all data ΓBV
= 0.979. Bottom: the structure function
S of
the variability; black boxes for B-band and red diamonds for V-band.
between all possible permutations of
measurements i,j with τ = |
tj −
ti |. Larger
dots mark the averages inside a bin of one day with their uncertainty plotted as a
continuous black line. The red straight line at 44.4° corresponds to the linear fit of
all data ΓBV
= 0.979. Bottom: the structure function
S of
the variability; black boxes for B-band and red diamonds for V-band.
Current usage metrics show cumulative count of Article Views (full-text article views including HTML views, PDF and ePub downloads, according to the available data) and Abstracts Views on Vision4Press platform.
Data correspond to usage on the plateform after 2015. The current usage metrics is available 48-96 hours after online publication and is updated daily on week days.
Initial download of the metrics may take a while.