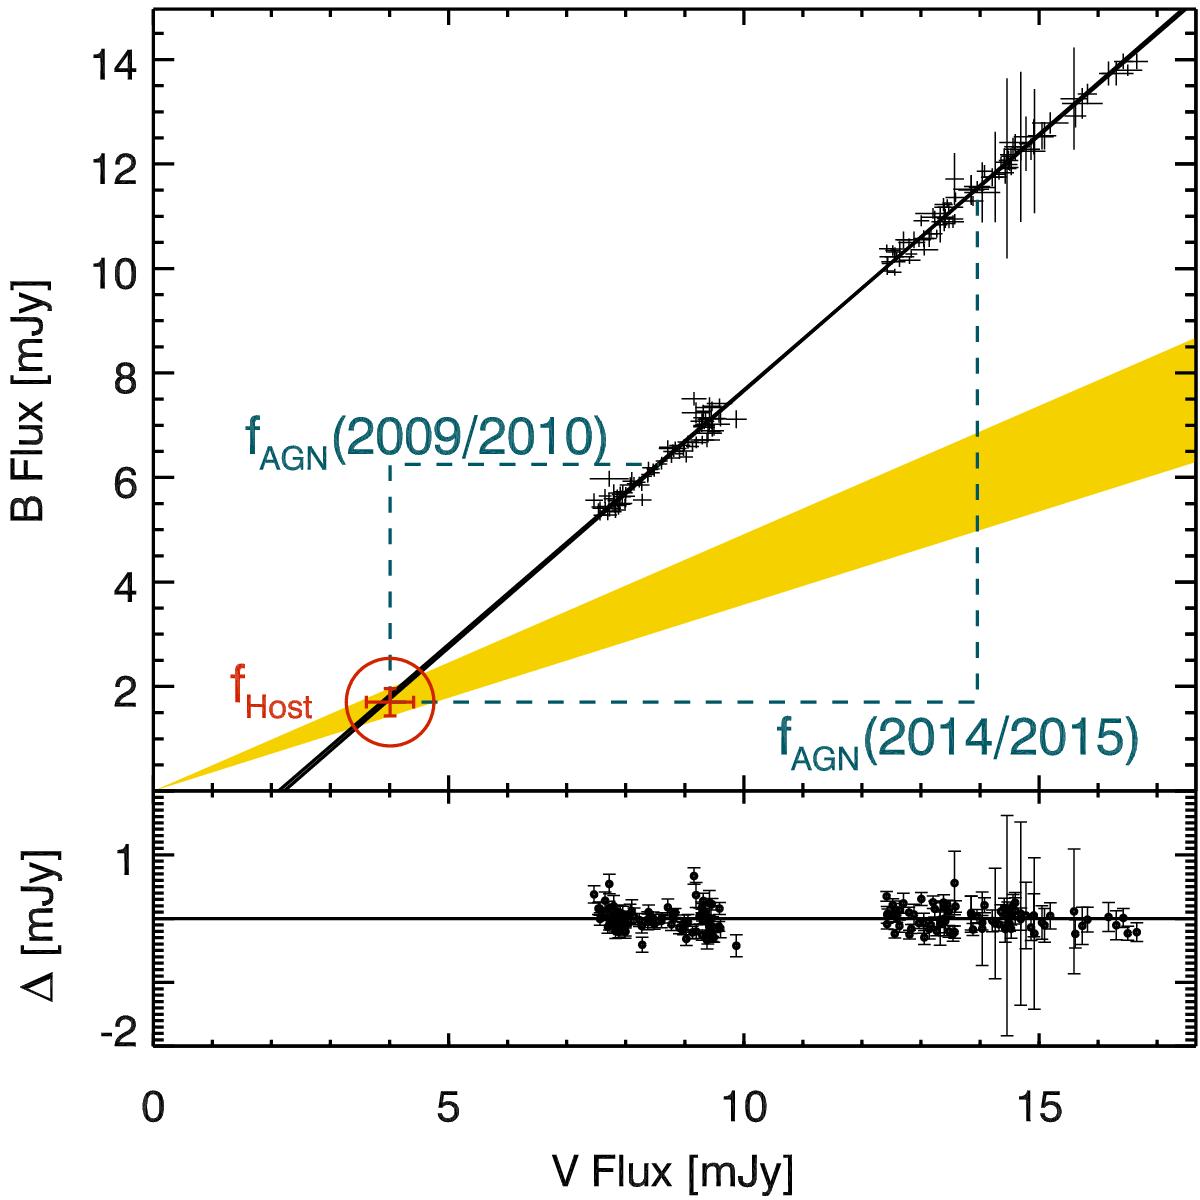
Fig. 3

B
versus V flux variations of 3C 120 in the
![]() aperture. Each measurement is
drawn as a thin cross in which the line length corresponds to the photometric
uncertainties in the respective filters. The yellow filled area is the assumed host
color ΓBV,Host, drawn to cover
B = (1.70 ±
0.27) mJy and V = (4.01 ± 0.62) mJy host fluxes, as
determined by Sakata et al. (2010) in an
aperture. Each measurement is
drawn as a thin cross in which the line length corresponds to the photometric
uncertainties in the respective filters. The yellow filled area is the assumed host
color ΓBV,Host, drawn to cover
B = (1.70 ±
0.27) mJy and V = (4.01 ± 0.62) mJy host fluxes, as
determined by Sakata et al. (2010) in an
![]() aperture. Our host flux estimate
is the datapoint in the red circle. All data from 2009 until 2015 was used to
determine the AGN slope. The black continuous line covers the upper and lower
standard deviations in the AGN slope, given by the OLS bisector fit.
aperture. Our host flux estimate
is the datapoint in the red circle. All data from 2009 until 2015 was used to
determine the AGN slope. The black continuous line covers the upper and lower
standard deviations in the AGN slope, given by the OLS bisector fit.
Current usage metrics show cumulative count of Article Views (full-text article views including HTML views, PDF and ePub downloads, according to the available data) and Abstracts Views on Vision4Press platform.
Data correspond to usage on the plateform after 2015. The current usage metrics is available 48-96 hours after online publication and is updated daily on week days.
Initial download of the metrics may take a while.


