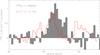
Fig. 4
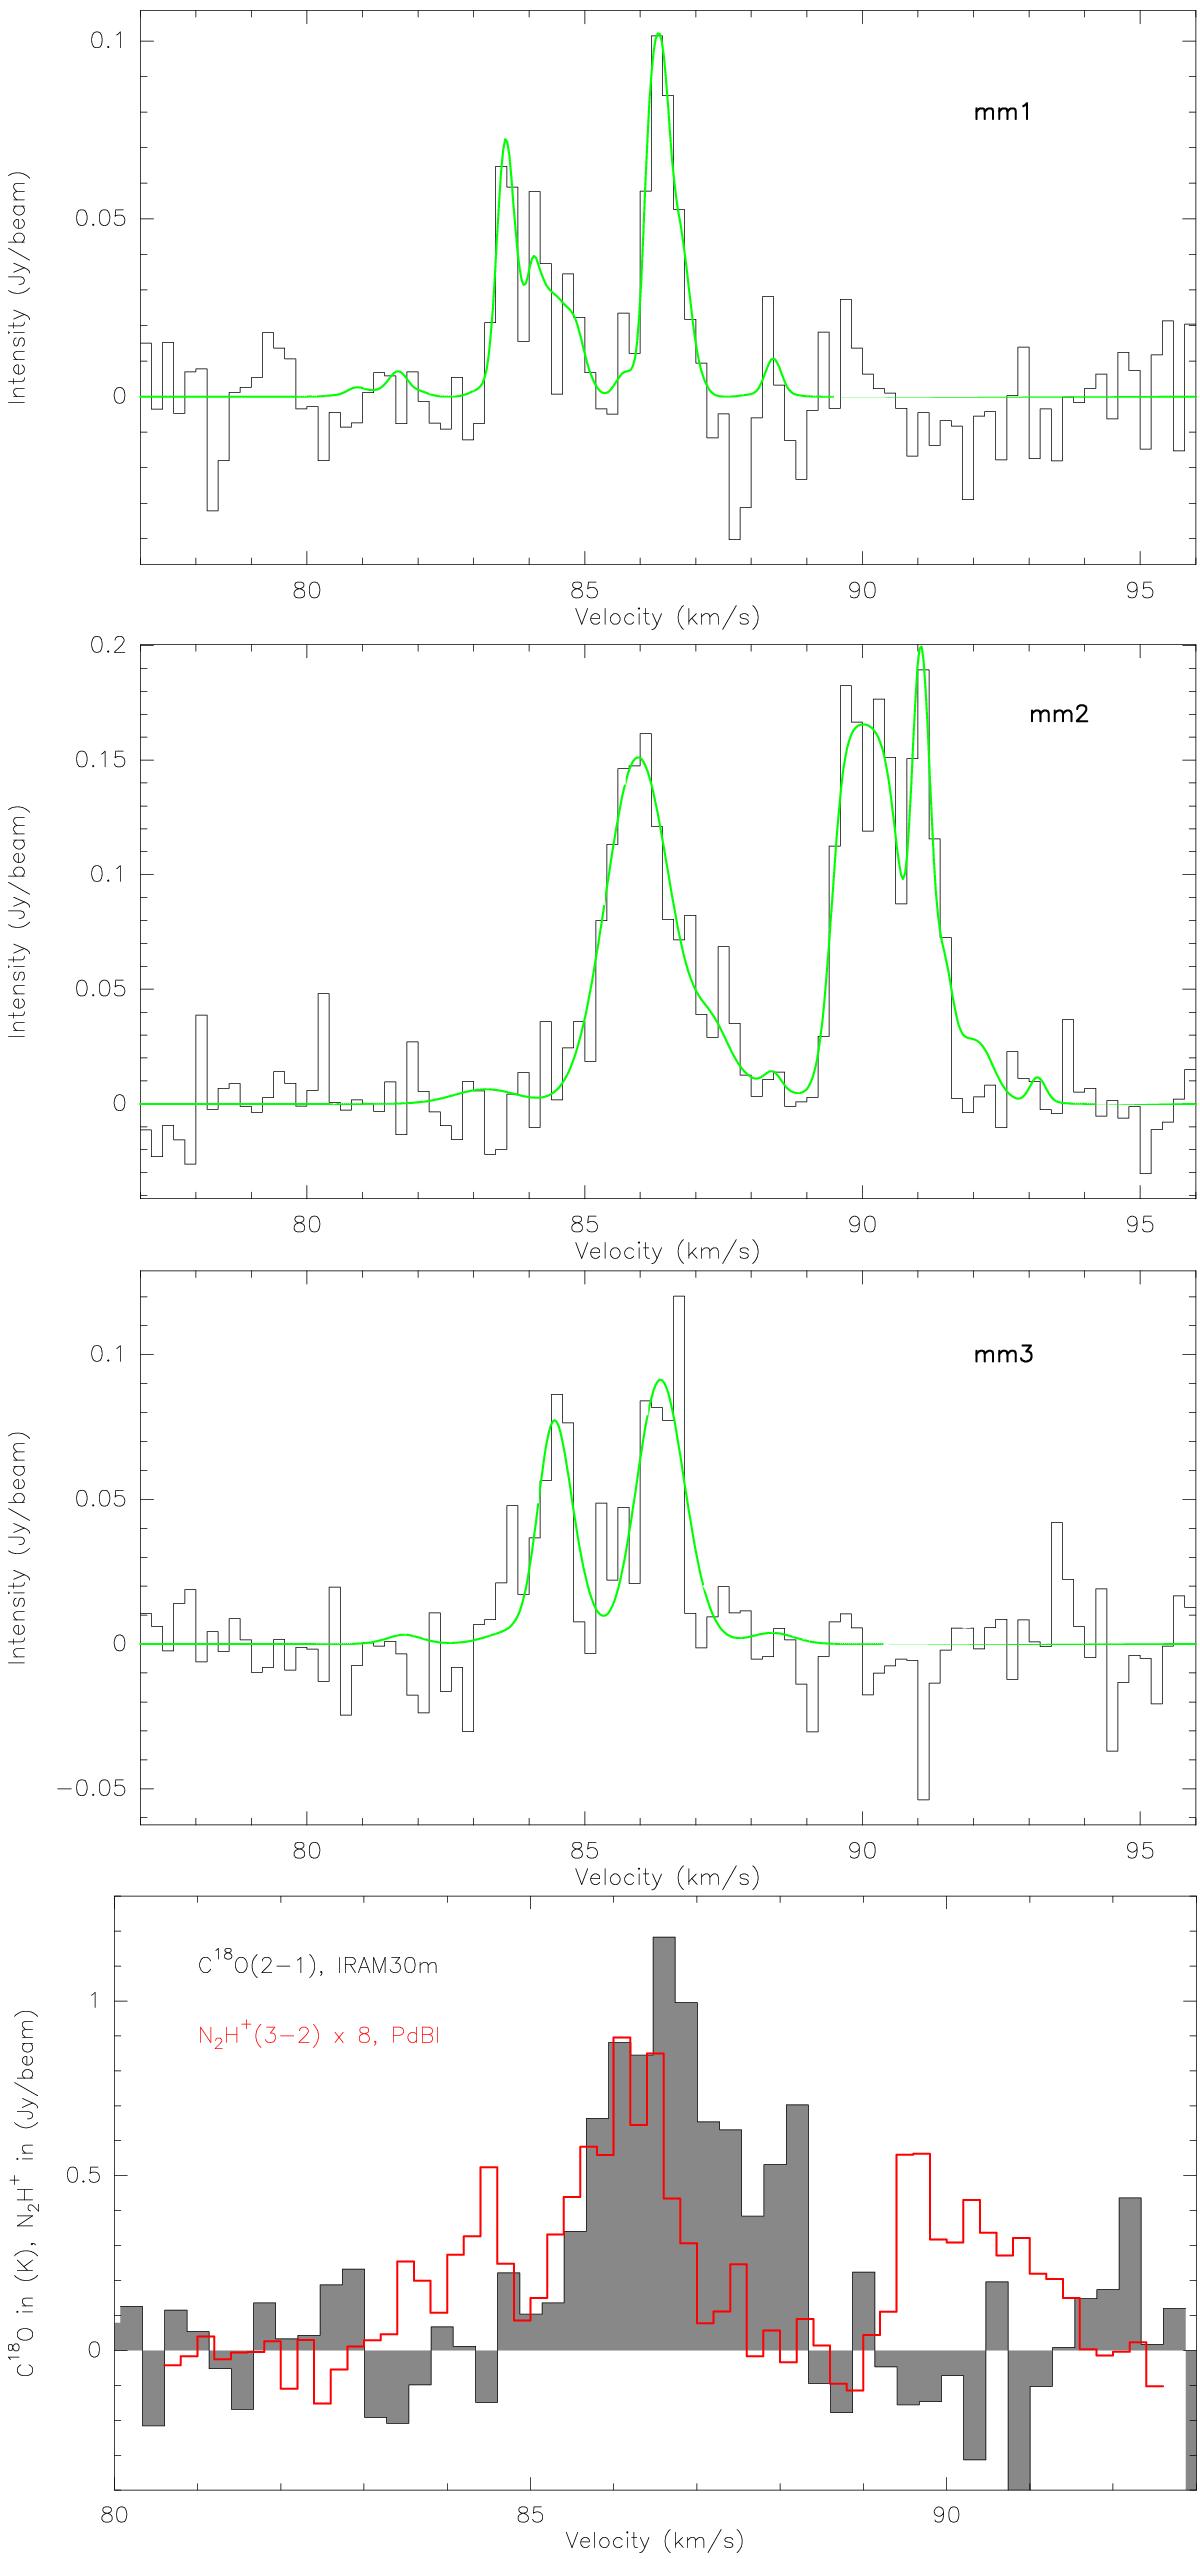
N2H+(3−2) spectra toward the three main peaks mm1, mm2, and mm3 with the multiple component hyperfine structure fits shown in green. The fit parameters are presented in Table 4. The bottom spectrum shows a comparison between a single-dish C18O(2–1) spectrum extracted toward the main peak in gray and an average of the above three N2H+(3−2) spectra (multiplied by 8) in red. The units in the bottom spectra are different for both as marked in the side label.
Current usage metrics show cumulative count of Article Views (full-text article views including HTML views, PDF and ePub downloads, according to the available data) and Abstracts Views on Vision4Press platform.
Data correspond to usage on the plateform after 2015. The current usage metrics is available 48-96 hours after online publication and is updated daily on week days.
Initial download of the metrics may take a while.