Fig. 3
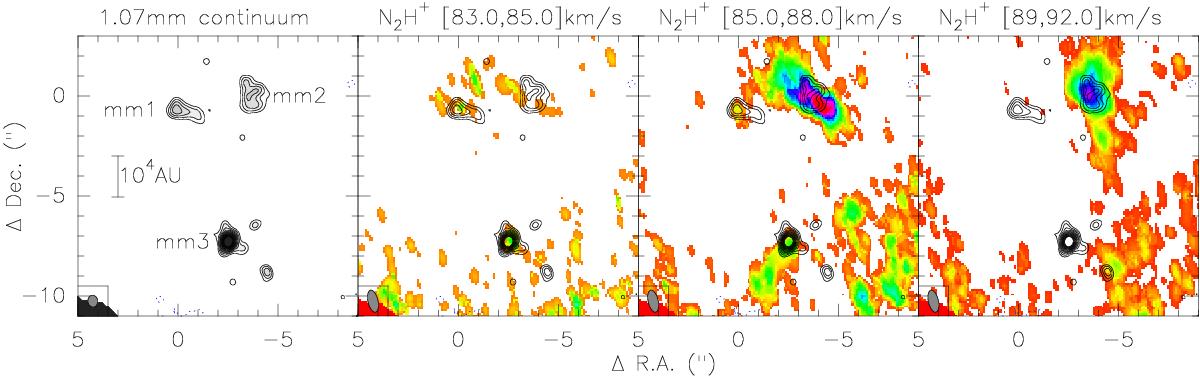
N2H+(3−2) and 1.07 mm continuum data. The left panel and the contours in the three other panels always show the 1.07 mm continuum data starting from 3σ and continuing in 1σ steps with a 1σ value of 0.6 mJy beam-1. The color scale in panels 2−4 present the N2H+(3−2) integrated emission over the velocity regimes marked above each panel. The scaling ranges in panels 2 to 4 are [0, 0.15], [0, 0.25], and [0, 0.4] Jy km s-1, respectively. The synthesized beam of the continuum and line data is shown each time in the bottom left. A scale bar can be found in the left panel.
Current usage metrics show cumulative count of Article Views (full-text article views including HTML views, PDF and ePub downloads, according to the available data) and Abstracts Views on Vision4Press platform.
Data correspond to usage on the plateform after 2015. The current usage metrics is available 48-96 hours after online publication and is updated daily on week days.
Initial download of the metrics may take a while.