Fig. 2
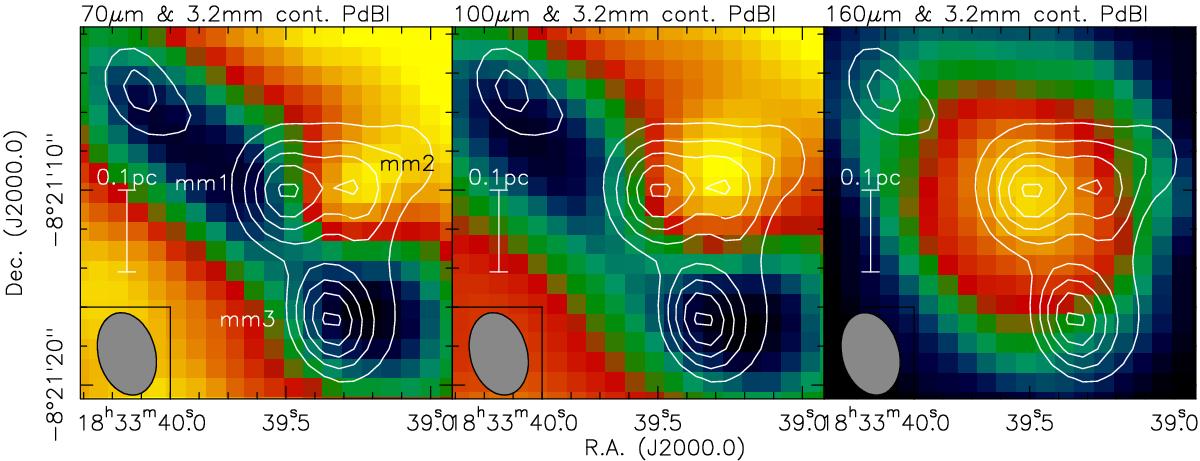
Re-calibrated Herschel/PACS images at 70, 100, and 160 μm (from left to right). The scaling in the three panels is from −3.8 to 4.0, from 5.0 to 17.6, and from 33 to 45 mJy pixel-1, respectively. The 3.2 mm continuum contours are from 3σ and continue in 2σ steps with a 1σ value of 0.08 mJy beam-1. A scale bar and the 3.2 mm synthesized beam are shown in each panel, and the three main sources are labeled in the bottom left panel. The 70, 100, and 160 μm PSFs are 5.6′′, 6.8′′, and 11.3′′, respectively.
Current usage metrics show cumulative count of Article Views (full-text article views including HTML views, PDF and ePub downloads, according to the available data) and Abstracts Views on Vision4Press platform.
Data correspond to usage on the plateform after 2015. The current usage metrics is available 48-96 hours after online publication and is updated daily on week days.
Initial download of the metrics may take a while.