Fig. 1
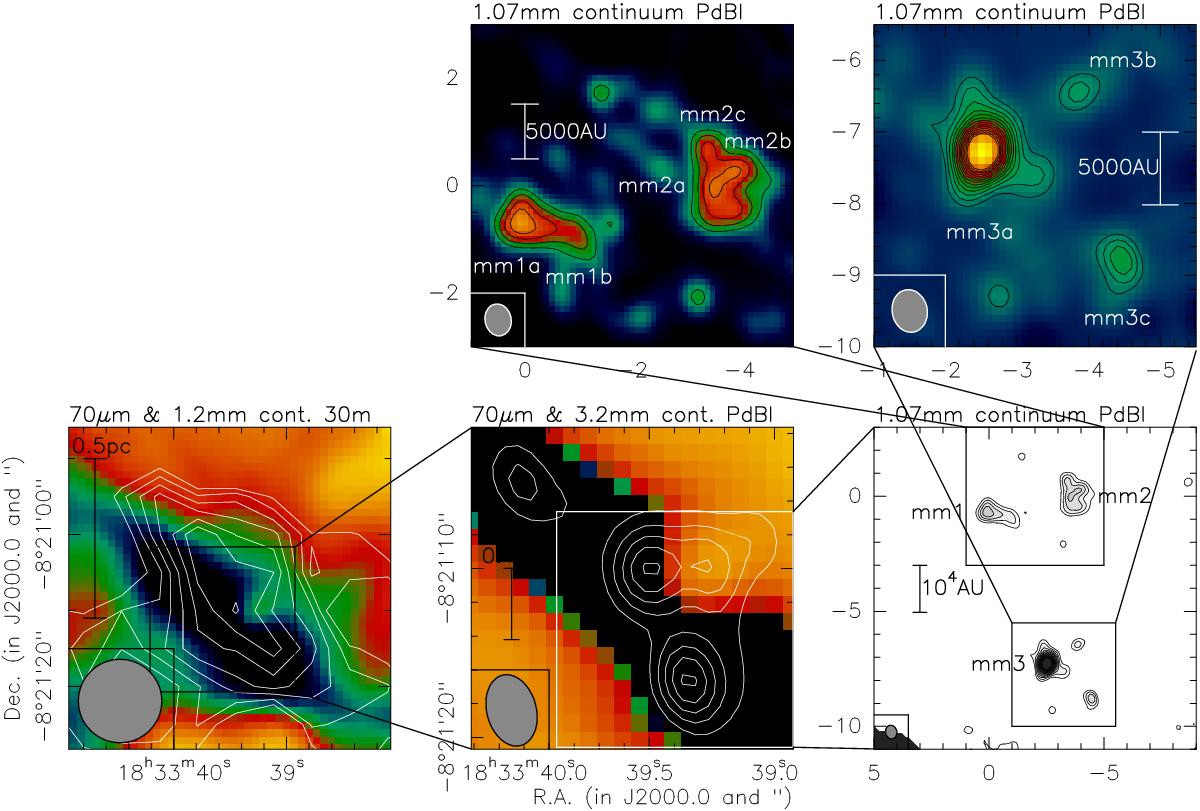
Compilation of the continuum images in IRDC 18310-4. The bottom left and middle panels show in color the Herschel 70 μm image with a stretch going dark for low values (Beuther et al. 2013b, linear and log stretch for clarity, respectively). The white contours in the left panel show the 1.2 mm MAMBO continuum observations starting from 4σ and continuing in 1σ steps with a 1σ value of 13 mJy beam-1. The contours in the bottom middle panel present the 3 mm continuum data from Beuther et al. (2013b) starting from 3σ and continuing in 2σ steps with a 1σ value of 0.08 mJy beam-1. The bottom right panel then shows the new 1.07 mm continuum observations starting from 3σ and continuing in 1σ steps with a 1σ value of 0.6 mJy beam-1. The two top panels show zooms of the 1.07 continuum data with the same contour levels but a different color stretch to highlight the substructures. Each panel presents scale bars and the corresponding synthesized beams. The 70 μm PSF is 5.6′′.
Current usage metrics show cumulative count of Article Views (full-text article views including HTML views, PDF and ePub downloads, according to the available data) and Abstracts Views on Vision4Press platform.
Data correspond to usage on the plateform after 2015. The current usage metrics is available 48-96 hours after online publication and is updated daily on week days.
Initial download of the metrics may take a while.