Free Access
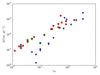
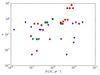
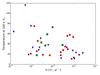
Fig. 6
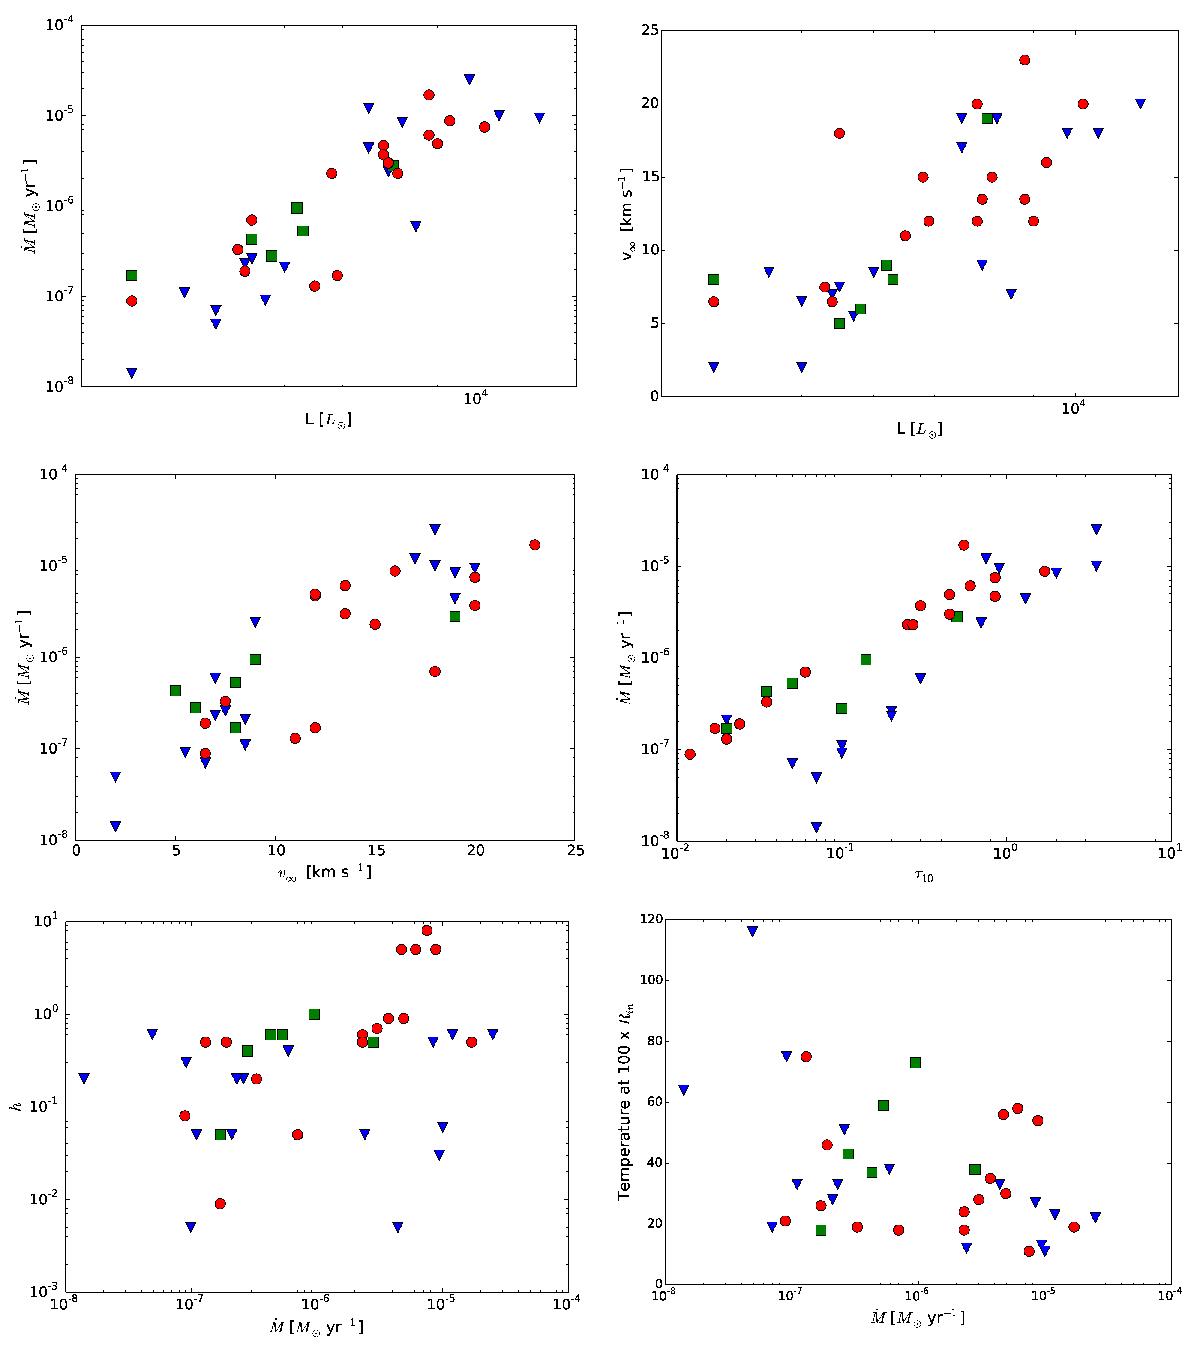
Mass-loss rate and expansion velocity plotted against luminosity; mass-loss rate plotted against expansion velocity, optical depth and the h-parameter; temperature in the CSE at a radius of 100 × Rin plotted against mass-loss rate. Carbon stars are red circles, S stars are green squares, M stars are blue triangles.
This figure is made of several images, please see below:
Current usage metrics show cumulative count of Article Views (full-text article views including HTML views, PDF and ePub downloads, according to the available data) and Abstracts Views on Vision4Press platform.
Data correspond to usage on the plateform after 2015. The current usage metrics is available 48-96 hours after online publication and is updated daily on week days.
Initial download of the metrics may take a while.