Free Access
Fig. B.7
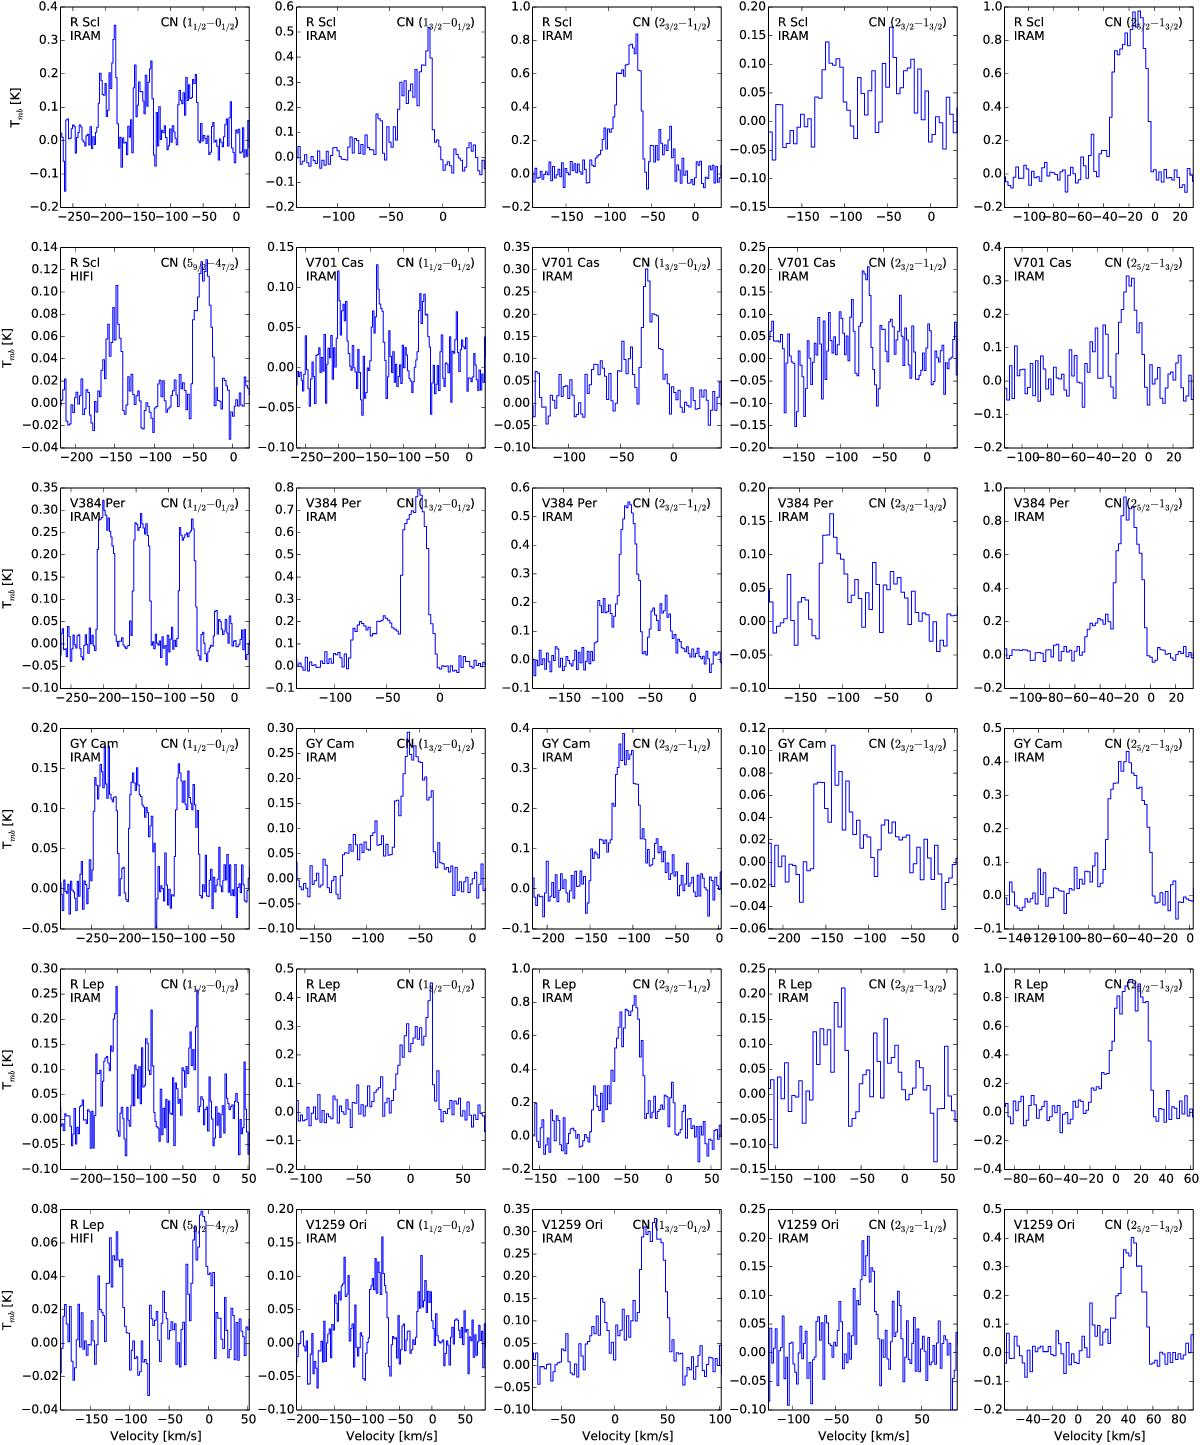
New CN data from HIFI and IRAM, plotted with respect to LSR velocity of the reddest component. In the case of the HIFI lines, both the (59/2 → 47/2) and (511/2 → 49/2) lines are plotted together at the rest frequency of the former.
Current usage metrics show cumulative count of Article Views (full-text article views including HTML views, PDF and ePub downloads, according to the available data) and Abstracts Views on Vision4Press platform.
Data correspond to usage on the plateform after 2015. The current usage metrics is available 48-96 hours after online publication and is updated daily on week days.
Initial download of the metrics may take a while.