Fig. 9
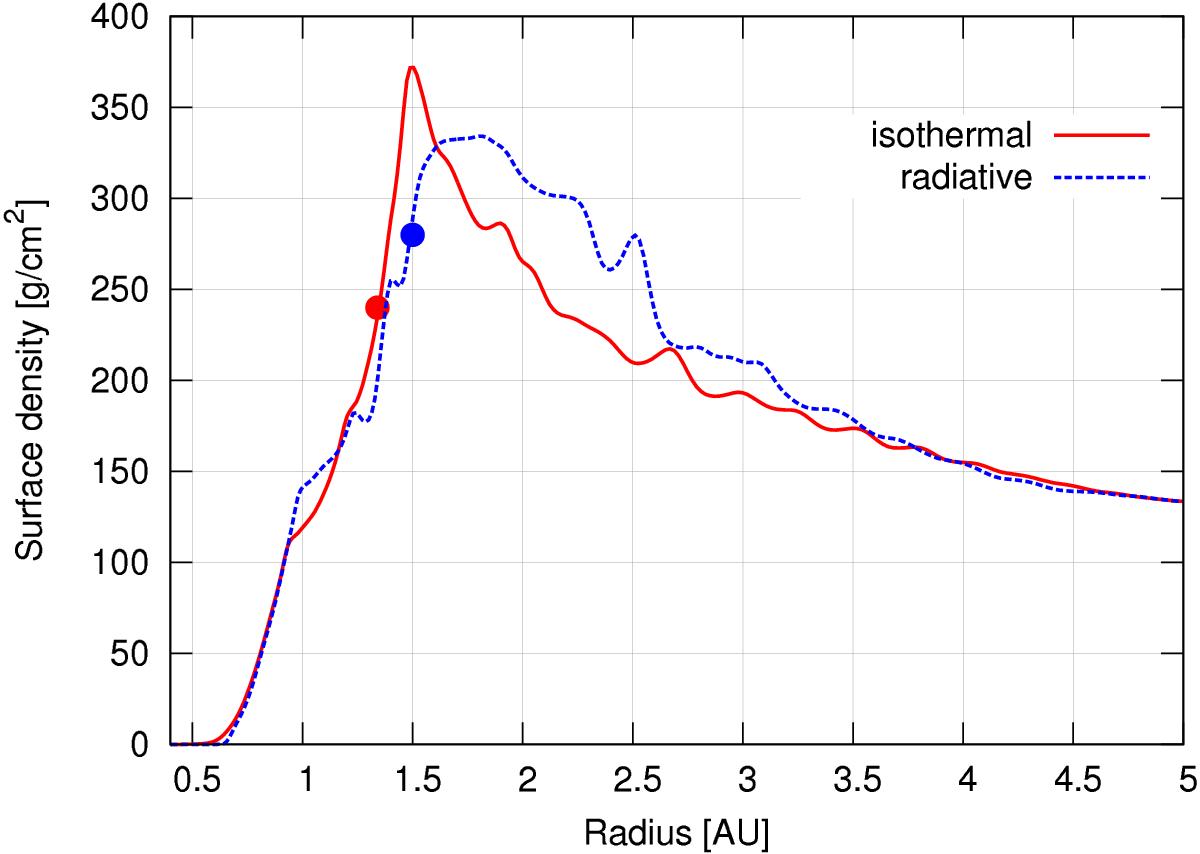
Graphs of the azimuthally averaged radial surface density of the isothermal and radiative disk models of Fig. 8 with an embedded planet. The density distributions are taken near the final state of the evolutions shown in Fig. 8. The big colored dot in each graph represents the semi-major axis of the planet at these times. For illustrative purposes, we have moved the circles close to their corresponding curves.
Current usage metrics show cumulative count of Article Views (full-text article views including HTML views, PDF and ePub downloads, according to the available data) and Abstracts Views on Vision4Press platform.
Data correspond to usage on the plateform after 2015. The current usage metrics is available 48-96 hours after online publication and is updated daily on week days.
Initial download of the metrics may take a while.