Fig. 11
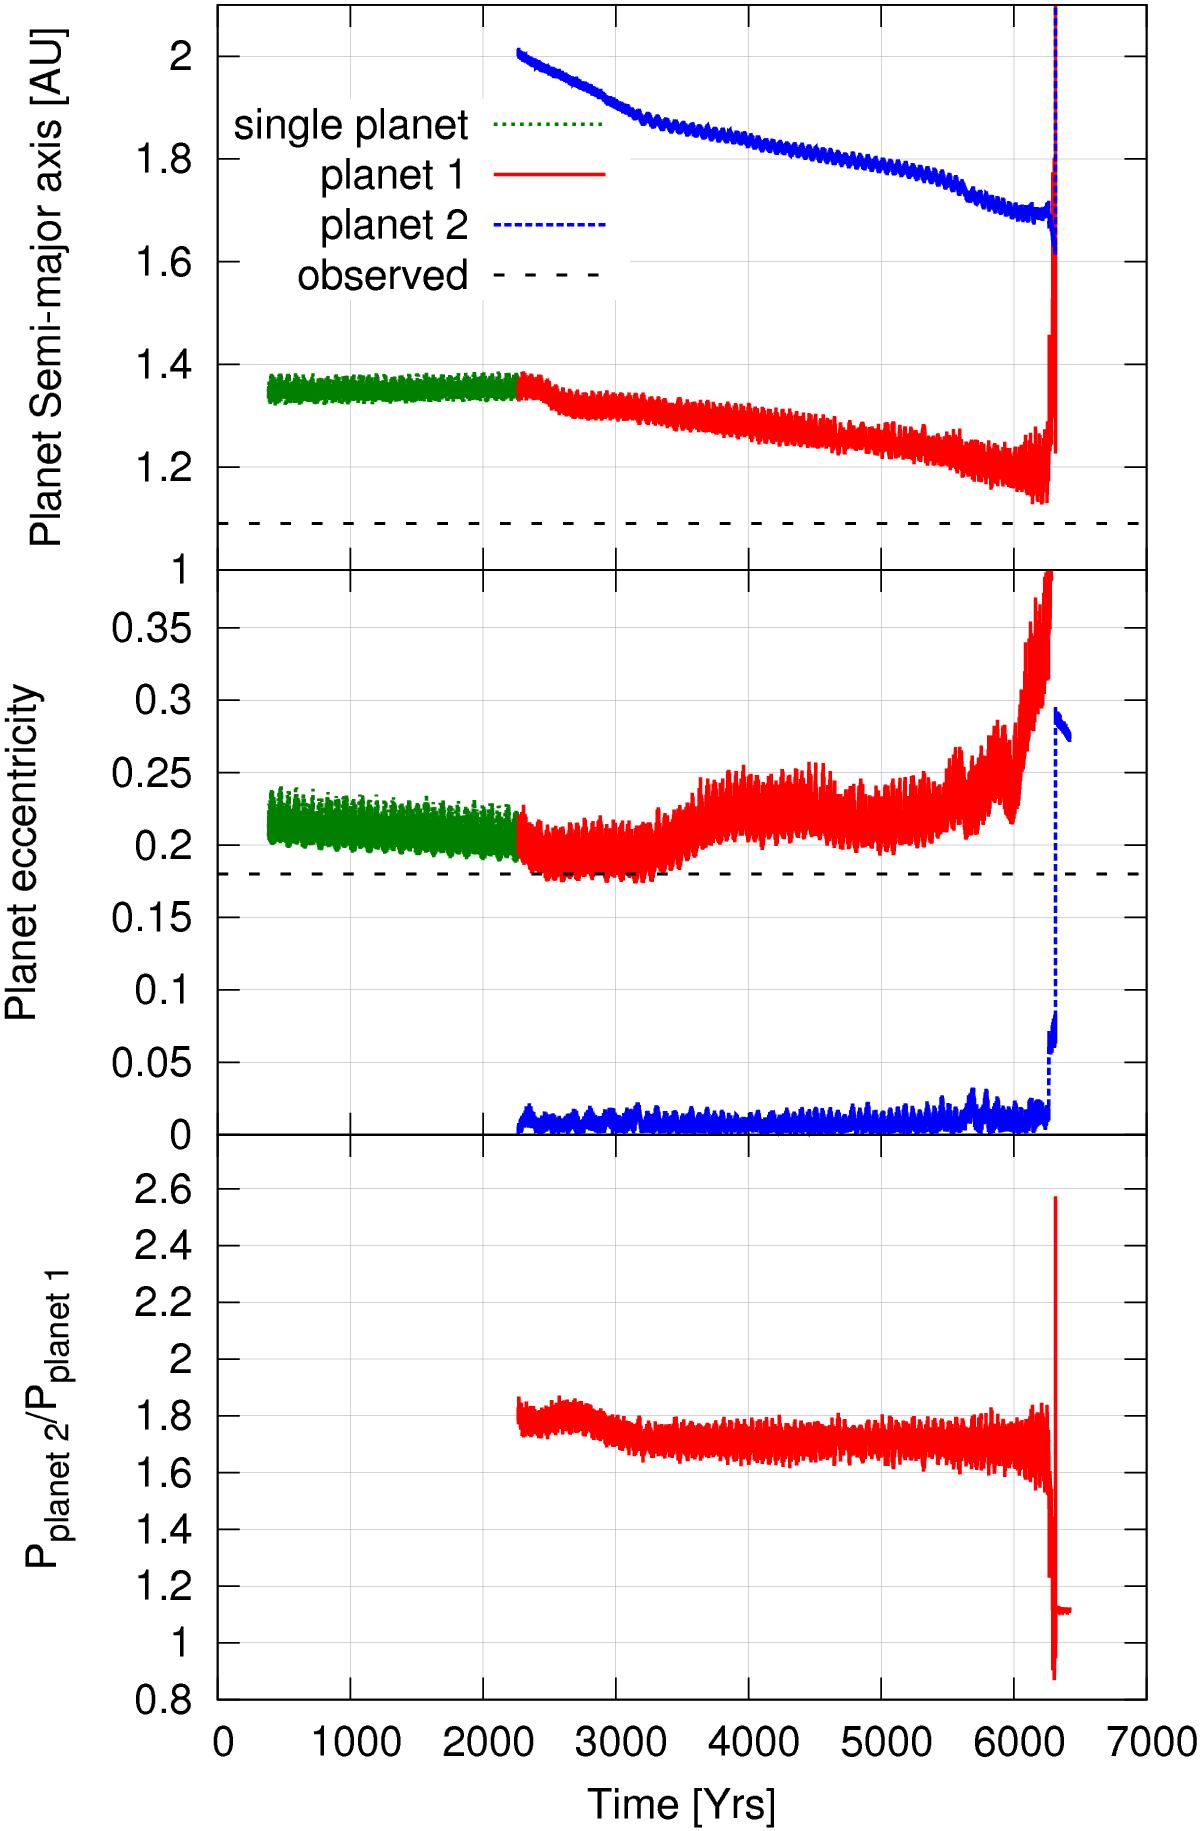
Evolution of the semi-major axis (top) and eccentricity (middle) of two embedded planets. The simulation was continued from the isothermal model shown in Fig. 8 (red line) by adding an additional planet with the same mass at 2.0 AU. The green curve corresponds to the original model with the new planet added at t ≈ 2300 yrs. The red curves correspond to the (original) inner planet and the blue curves is for the (additional) outer planet. The bottom panel shows the period ratio (outer/inner) of the two planets.
Current usage metrics show cumulative count of Article Views (full-text article views including HTML views, PDF and ePub downloads, according to the available data) and Abstracts Views on Vision4Press platform.
Data correspond to usage on the plateform after 2015. The current usage metrics is available 48-96 hours after online publication and is updated daily on week days.
Initial download of the metrics may take a while.