Free Access
Fig. 1
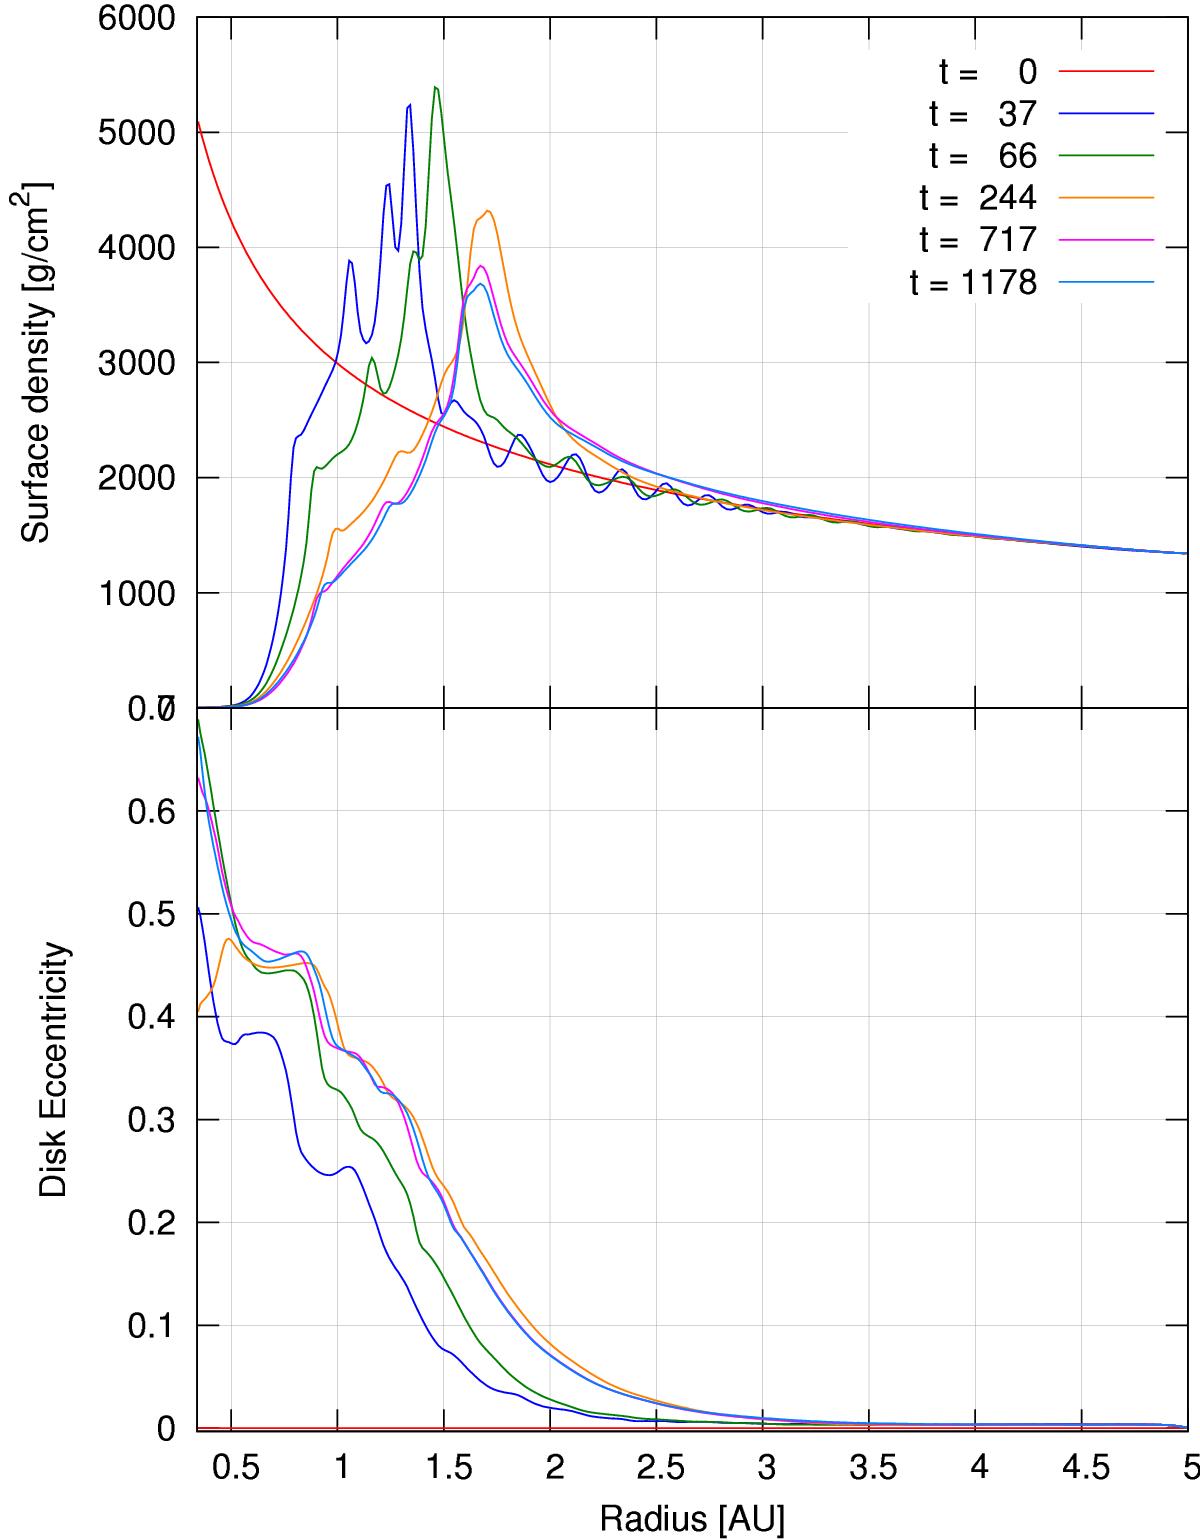
Azimuthally averaged surface density (top) and disk eccentricity (bottom) for our locally isothermal reference model. Shown here are the profiles at different evolutionary times (in years); the red curve denotes the initial setup.
Current usage metrics show cumulative count of Article Views (full-text article views including HTML views, PDF and ePub downloads, according to the available data) and Abstracts Views on Vision4Press platform.
Data correspond to usage on the plateform after 2015. The current usage metrics is available 48-96 hours after online publication and is updated daily on week days.
Initial download of the metrics may take a while.