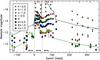
Fig. 1

a) Absolute light curves of SNHunt248. The solid vertical lines indicate the epochs of spectroscopic observations. For comparison, we show the absolute R-band light curve of SN 2009ip (Pastorello et al. 2013; Fraser et al. 2013, 2015, black curve: JD = 2 456 155 corresponds to day 0, no shift in magnitude; and green curve: day 0 epoch JD = 2 456 195, + 3.0 mag shift) emphasizing the similar evolution between some of the key phases. b) Colour evolution of SNHunt248. c) Historical light curve of SNHunt248. From day 0 onwards only the R-band points are included for clarity. The HST archival data points from Mauerhan et al. (2015) are shown with open symbols. The R-band points are connected with a dotted line to guide the eye (for epochs with an I-band point but a missing R-band magnitude, the latter is very roughly estimated assuming R − I = 0.2 mag, corresponding to the −740 d spectral energy distribution (SED)). Insets display blackbody fits to selected pre- and post-discovery epochs of observed data (interpolated post-discovery near-IR data are included for comparison).
Current usage metrics show cumulative count of Article Views (full-text article views including HTML views, PDF and ePub downloads, according to the available data) and Abstracts Views on Vision4Press platform.
Data correspond to usage on the plateform after 2015. The current usage metrics is available 48-96 hours after online publication and is updated daily on week days.
Initial download of the metrics may take a while.