Fig. 8
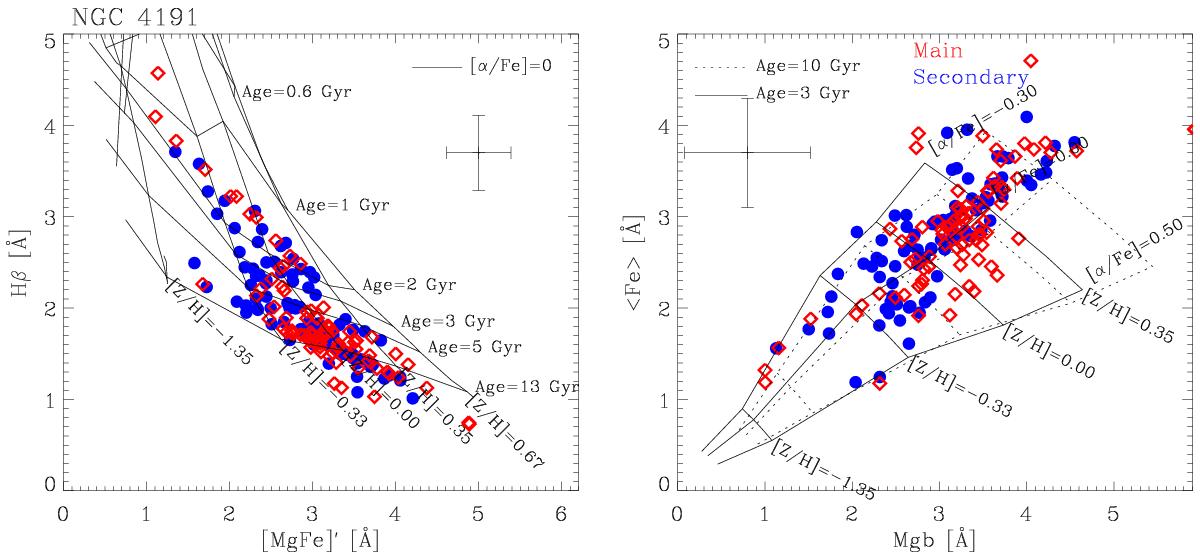
Line strength indices of the two counter-rotating stellar components in NGC 4191. Blue filled circles and red open diamonds refer to the main and secondary component, respectively. The error bars represent the mean errors in the measurements. The line grids represent the predictions of simple stellar population models (Thomas et al. 2003). Spatial bins with S/N lower than 25 per Å are not considered.
Current usage metrics show cumulative count of Article Views (full-text article views including HTML views, PDF and ePub downloads, according to the available data) and Abstracts Views on Vision4Press platform.
Data correspond to usage on the plateform after 2015. The current usage metrics is available 48-96 hours after online publication and is updated daily on week days.
Initial download of the metrics may take a while.