Fig. 7
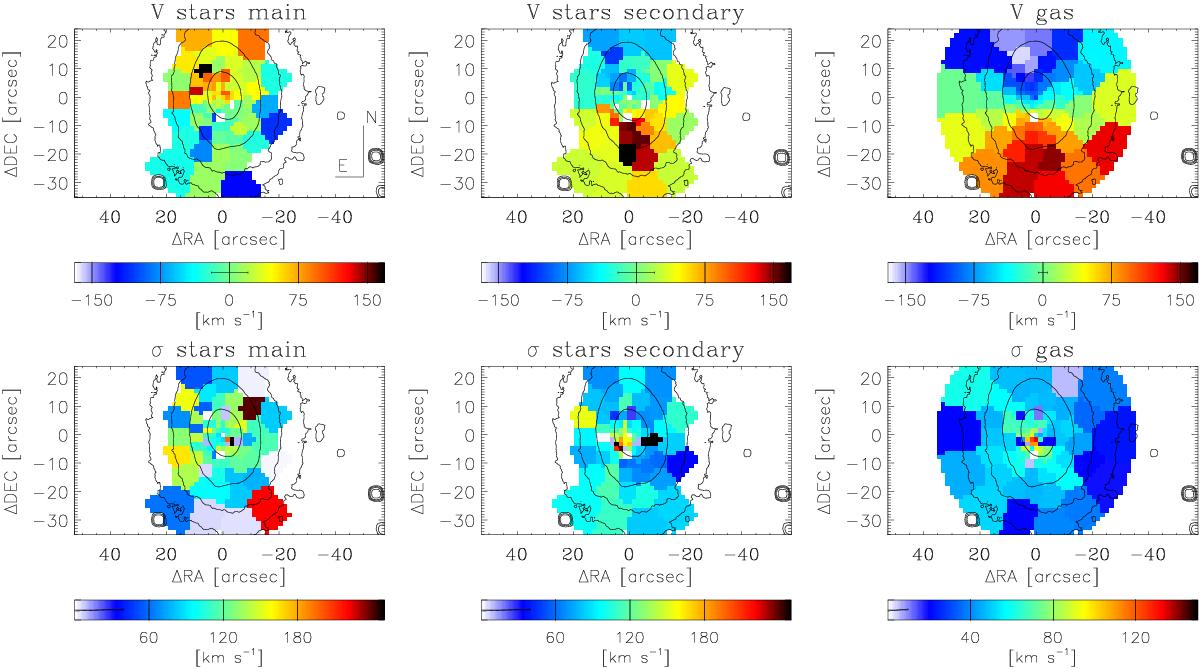
Result of the spectral decomposition of NGC 4191. Velocity (top panels) and velocity dispersion (bottom panels) maps for the main stellar component (left panels), secondary counter-rotating stellar component (central panels), and counter-rotating ionized-gas component (right panels) are shown. Spatial bins with S/N lower than 25 per Å are not shown for the stellar components. The horizontal bars in the color scale at the bottom of each panel indicate the mean error.
Current usage metrics show cumulative count of Article Views (full-text article views including HTML views, PDF and ePub downloads, according to the available data) and Abstracts Views on Vision4Press platform.
Data correspond to usage on the plateform after 2015. The current usage metrics is available 48-96 hours after online publication and is updated daily on week days.
Initial download of the metrics may take a while.