Fig. 4
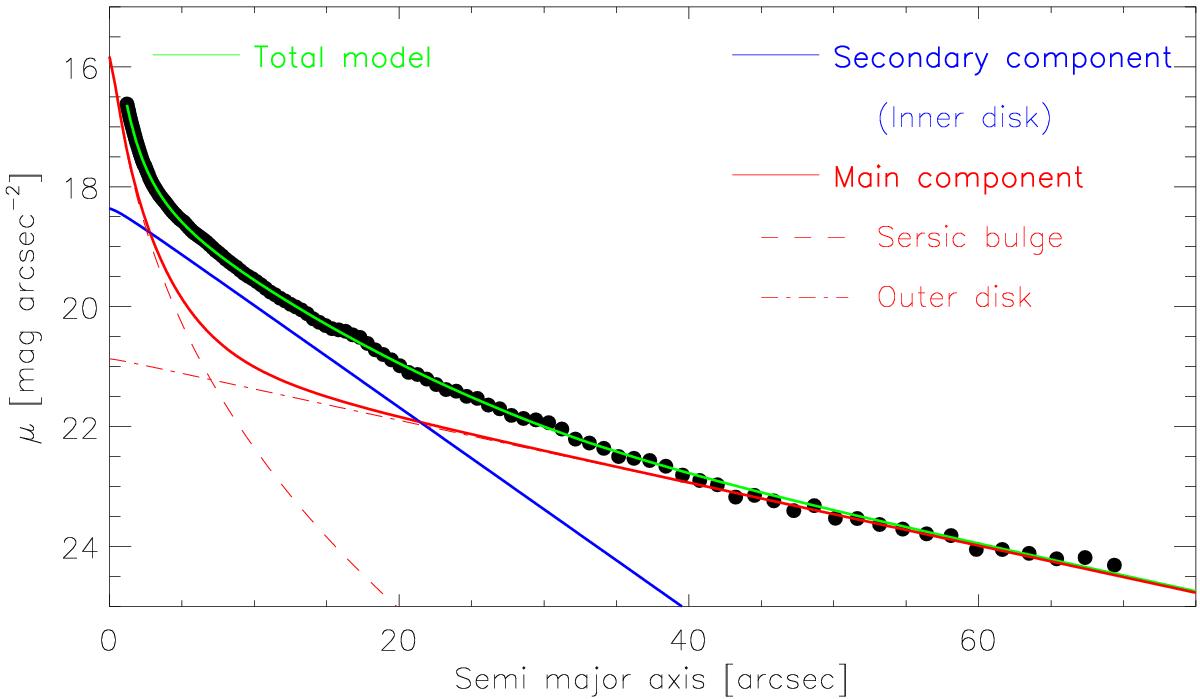
Results of the photometric decomposition. Filled circles: surface brightness radial profile measured on the SDSS g-band image with the iraf task ellipse. The blue curve is the best-fitting inner disk component, the red dashed curve is the best-fitting Sérsic bulge, and the red dot-dashed curve is the outer disk component. The green curve is the sum of all the best-fitting components. Red and blue curves represent the profiles of the adopted definition for the main and secondary kinematics components, respectively.
Current usage metrics show cumulative count of Article Views (full-text article views including HTML views, PDF and ePub downloads, according to the available data) and Abstracts Views on Vision4Press platform.
Data correspond to usage on the plateform after 2015. The current usage metrics is available 48-96 hours after online publication and is updated daily on week days.
Initial download of the metrics may take a while.