Free Access
Fig. 3
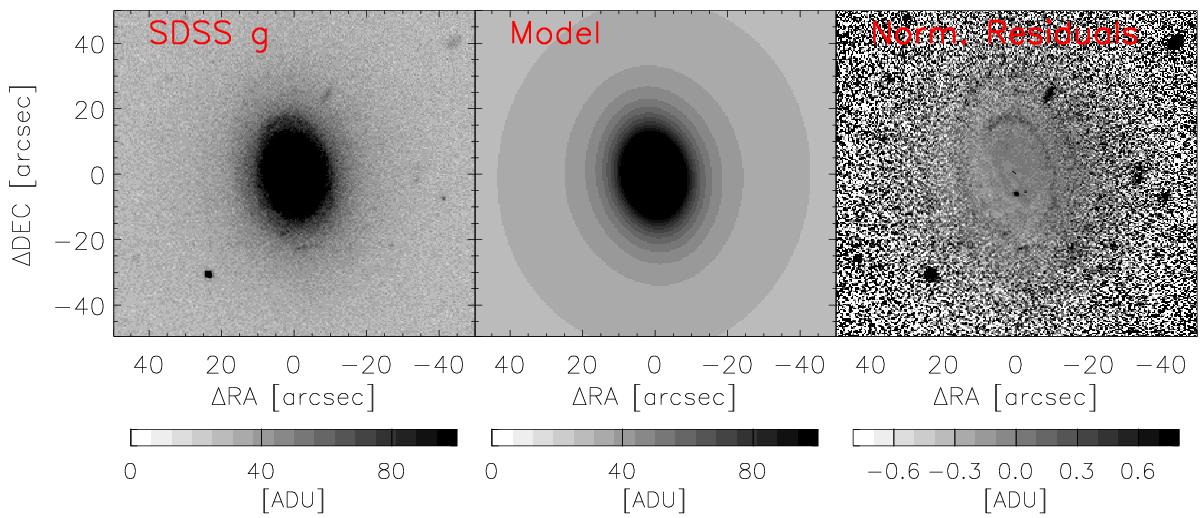
Result of the photometric decomposition of NGC 4191. Left panel: SDSS g image; central panel: best-fit model; right panel: normalized residuals (data – model)/model. North is up and east is left.
Current usage metrics show cumulative count of Article Views (full-text article views including HTML views, PDF and ePub downloads, according to the available data) and Abstracts Views on Vision4Press platform.
Data correspond to usage on the plateform after 2015. The current usage metrics is available 48-96 hours after online publication and is updated daily on week days.
Initial download of the metrics may take a while.