Fig. A.1
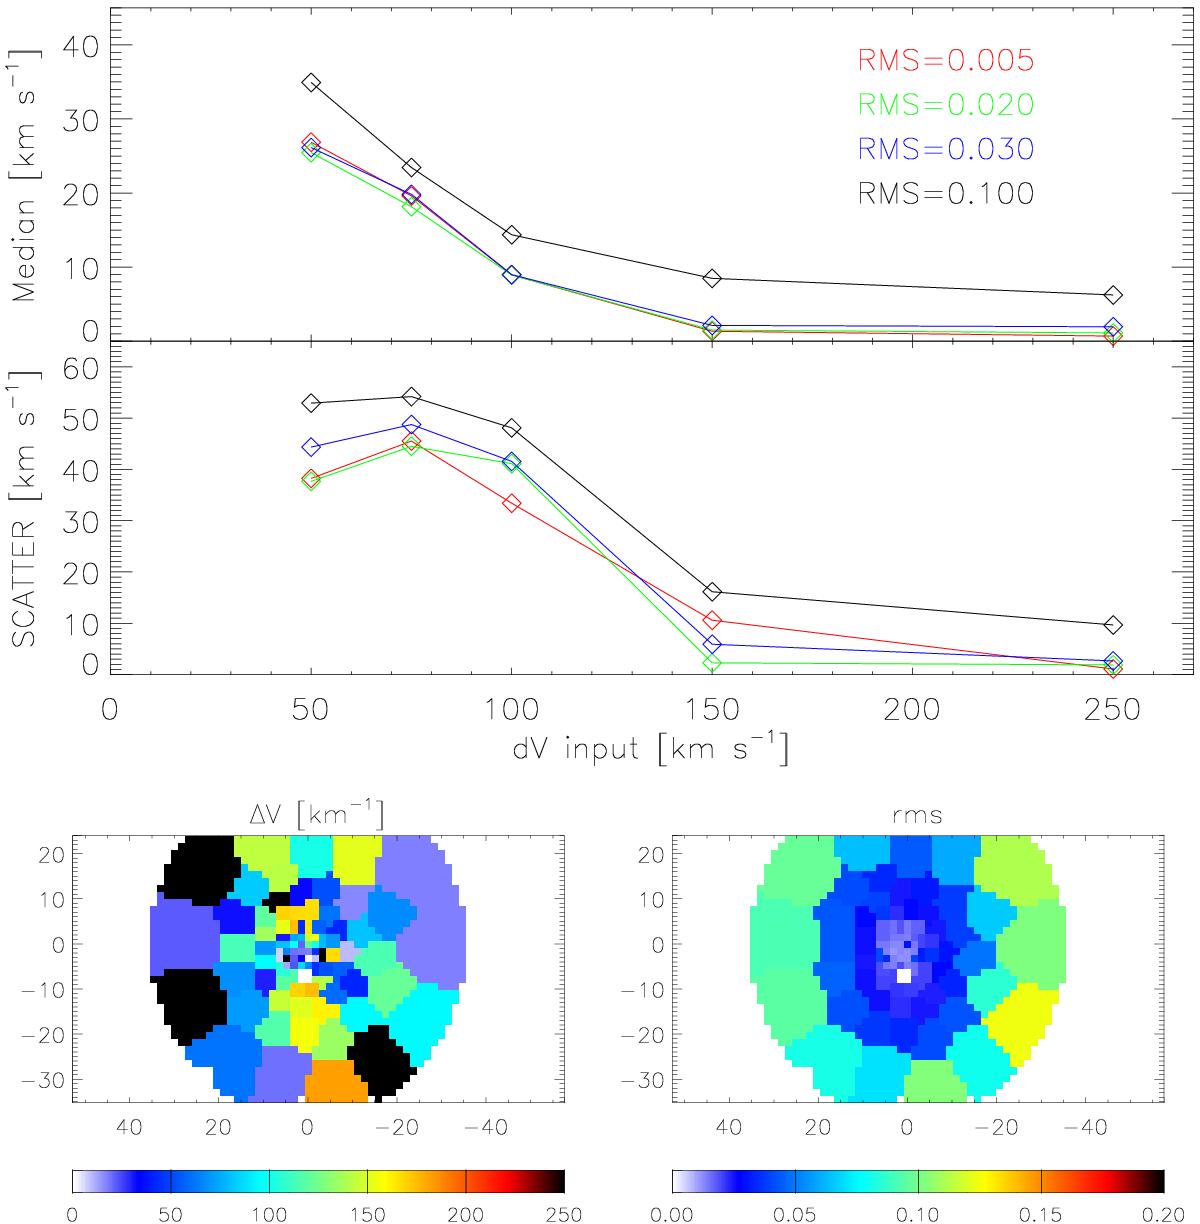
Top panel: median value (top panel) and standard deviation (bottom panel) of the error on the recovered velocities as a function of the velocity difference between the two simulated stellar components. Different lines represent different S/N values per Å: 480 (rms = 0.005), 120, 80, and 24 (rms = 0.1). Bottom panel: two-dimensional maps of the absolute velocity difference between the two stellar components (left panel) and the fit rms (right panel).
Current usage metrics show cumulative count of Article Views (full-text article views including HTML views, PDF and ePub downloads, according to the available data) and Abstracts Views on Vision4Press platform.
Data correspond to usage on the plateform after 2015. The current usage metrics is available 48-96 hours after online publication and is updated daily on week days.
Initial download of the metrics may take a while.