| Issue |
A&A
Volume 581, September 2015
|
|
|---|---|---|
| Article Number | A70 | |
| Number of page(s) | 10 | |
| Section | Stellar atmospheres | |
| DOI | https://doi.org/10.1051/0004-6361/201526558 | |
| Published online | 03 September 2015 | |
Grid of theoretical NLTE equivalent widths of four Ba ii lines and barium abundance in cool stars⋆,⋆⋆
1 Department of Astronomy and Astronomical Observatory, Odessa National University, and Isaac Newton Institute of Chile Odessa branch, Shevchenko Park, 65014 Odessa, Ukraine
e-mail: This email address is being protected from spambots. You need JavaScript enabled to view it.
2 GEPI, Observatoire de Paris, PSL, Research University, CNRS, Univ. Paris Diderot, Sorbonne Paris Cité, Place Jules Janssen, 92195 Meudon, France
3 Dark Cosmology Centre, Niels Bohr Institute, The University of Copenhagen, Juliane Maries Vej 30, 2100 Copenhagen Ø, Denmark
4 Istituto Nazionale di Astrofisica – Osservatorio Astronomico di Trieste, via Tiepolo 11, 34143 Trieste, Italy
Received: 19 May 2015
Accepted: 14 July 2015
Abstract
Context. We present a grid of computed non-local thermodynamic equilibrium (NLTE) equivalent widths (EW) and NLTE abundance corrections for four Ba ii lines: 4554, 5853, 6141, and 6496 Å.
Aims. The grid can be useful in deriving the NLTE barium abundance in stars having parameters in the following ranges: effective temperature from 4000 K to 6500 K, surface gravity log g from 0 to 5, microturbulent velocity 0 km s-1 to 3 km s-1, metallicity [Fe/H] from –2 to +0.5, and [Ba/Fe] from –0.4 to +0.6. The NLTE abundance can be either derived by EW interpolation (using the observed Ba ii line EW) or by using the NLTE correction applied to a previously determined LTE abundance.
Methods. Ba ii line equivalent widths and the NLTE corrections were calculated using the updated MULTI code and the Ba ii atomic model that was previously applied to determine the NLTE barium abundance in different types of stars.
Results. The grid is available on-line through the web, and we find that the grid Ba NLTE corrections are almost as accurate as direct NLTE profile fitting (to within 0.05–0.08 dex). For the weakest Ba ii line (5853 Å) the LTE abundances almost agree with the NLTE abundances, whereas the other three Ba ii lines, 4554, 6141, and 6496 Å, need NLTE corrections even at the highest metallicities tested here. The 4554 Å line is extremely strong and should not be used for abundance analysis above [Fe/H] = −1. Furthermore, we tested the impact of different model atmospheres and spectrum synthesis codes and found average differences of 0.06 dex and 0.09 dex, respectively, for all four lines. At these metallicities we find an average ΔNLTE of ± 0.1 dex for the three useful Ba lines for subsolar cool dwarfs.
Key words: line: profiles / stars: abundances / stars: late-type
Tables 4 and 5 are only available at the CDS via anonymous ftp to cdsarc.u-strasbg.fr (130.79.128.5) or via http://cdsarc.u-strasbg.fr/viz-bin/qcat?J/A+A/581/A70
Appendix A is available in electronic form at http://www.aanda.org
© ESO, 2015
1. Introduction
Barium is one of the chemical elements that attracts close attention of the specialists working in the field of the Galactic chemical evolution. This element is mainly produced by the s-process in low-mass AGB stars (e.g., Busso et al. 1999; Cristallo et al. 2011; Bisterzo et al. 2010; Karakas & Lattanzio 2014). It serves as a reference element in an estimation of the relative efficiency of the s- and r-process nucleosyntheses (see e.g. Christlieb et al. 2004; Hansen et al. 2012).
Usually, the four strongest lines of ionized barium in the visual part of the spectrum are studied. They are located at 4554, 5853, 6141, and 6496 Å. These lines can be quite strong in the spectra of solar metallicity stars, and therefore they require the non-local thermodynamic equilibrium (NLTE) consideration. On the other hand, in metal-poor stars they can have much smaller equivalent widths, which may seem to be appropriate for the LTE analysis from an equivalent width perspective. Nevertheless, in such stars the concentration of free electrons in the atmosphere is decreased, which causes a significant deviation from LTE. To derive the correct barium abundance in stars of different metallicities, one therefore needs to perform either the direct barium line profile fitting (the NLTE synthetic spectrum technique, which is the best way), or to take into account the calculated NLTE corrections in an LTE analysis (the less reliable way). Despite the lower reliability, the second approach can be very effective for estimating the barium abundances in large samples of stars.
This paper presents a grid of NLTE barium line equivalent widths and NLTE corrections in cool stars that can be used for the barium abundance estimate. The method of the NLTE calculations is described in the next section.
2. Ba ii atomic model and NLTE calculations
Our Ba ii atomic model was first described among other things in Andrievsky et al. (2009), where it was applied to investigate a sample of very metal-poor Galactic halo stars (cool dwarfs and giants). It was later used to study Galactic thick- and thin-disc intermediate-to-cool dwarfs of different metallicities (Korotin et al. 2010, 2011; Mishenina et al. 2012, 2013c), large proper motion metal-deficient G-K stars (Klochkova et al. 2011a,b), red giants in the globular cluster NGC 6752 (Dobrovolskas et al. 2012; Thygesen et al. 2014), red giants of the globular clusters M 10 and M 71 (Mishenina et al. 2009), cool semiregular variable giants of the SRd type (Britavskiy et al. 2010, 2012), RR Lyr-type stars (Andrievsky et al. 2010; Hansen et al. 2011), intermediate-to-cool dwarfs in open clusters (D’Orazi et al. 2012; Mishenina et al. 2013a,b, 2014a,b), and intermediate-to-cool supergiant stars of nearly solar metallicity in the Galactic thin-disc stars (Andrievsky et al. 2013, 2014).
Below we briefly describe our model of the barium atom. It consists of 31 levels of Ba i, 73 levels of Ba ii, and the ground level of Ba iii. Ninety-one bound-bound transitions between the first 28 levels of Ba ii (n< 12 and l< 5) are computed in detail. Populations of the remaining levels are used to conserve the particle number. For two levels, 5d2D and 6p2P0, the fine structure is taken into account. The information about the adopted oscillator strengths, photoionization cross-sections, collisional rates, and broadening parameters can be found in Andrievsky et al. (2009). Atomic level populations were determined using the MULTI code of Carlsson (1986) with modifications as given in Korotin et al. (1999). The MULTI code calculates the line profile for each line that is considered in detail. The line profiles are computed assuming NLTE approximation and depend upon many parameters: the effective temperature of the model, the surface gravity, the microturbulent velocity, and the line damping, as well as the populations of the relevant levels.
The barium atom has seven isotopes. For the two odd isotopes 135Ba and 137Ba the hyper-fine structure is important. This effect is most pronounced for the Ba ii lines 4554 and 6496 Å. As was shown by Mashonkina et al. (1999) for adequate barium line modelling, it is sufficient to use the three-component model suggested by Rutten (1978). To calculate the Ba line profiles in the spectra of young stars, the even-to-odd abundance ratio of 82:18 can be used as a rule (Cameron 1982), and for the very old stars the ratio is 50:50. For our grid we used the ratio 82:18.
All the atmosphere models used for the grid of NLTE equivalent widths and correction calculations were interpolated basing on the ATLAS9 model atmosphere grid of Castelli & Kurucz (2003).
3. Grid of the NLTE equivalent widths and corrections
The following stellar parameter ranges are covered by our grid, which focuses on more metal-rich stars (compared to the very metal-poor and extremely metal-poor stas) that are typically targeted in current and future surveys:
-
effective temperature: 4000–6500* K, step = 250 K;
-
surface gravity: 0–5, step = 0.5
-
microturbulent velocity: 0–3 km s-1, step = 1 km s-1;
-
metallicity: [Fe/H] = +0.5, 0.0, –0.5, –1.0, –1.5 and –2.0;
-
relative barium abundance: [Ba/Fe] = –0.40, –0.20, 0.00, +0.20, +0.40, +0.60.
For the models with [Fe/H] below –1.00 we calculated NLTE equivalent widths with an increased atmosphere abundance of α-elements (α/Fe] = +0.4), while for a metallicity of –0.5 both cases (solar alpha-element abundance and an increased one) were considered. The asterisk indicates that at this temperature we do not have NLTE calculations for log g = 0, since there is no existing model atmosphere for this combination of stellar parameters.
The NLTE equivalent widths of the four barium lines were calculated: 4554, 5853, 6141, and 6496 Å. The corresponding parameters of these lines are given in Table 1.
Barium line parameters.
Tables 4 and 5 (available in electronic form at the CDS) contain the NLTE equivalent widths and NLTE corrections, respectively. For each barium line we selected six values of [Ba/Fe] (−0.4, –0.2, 0.0, +0.2, +0.4 and +0.6) for the NLTE EW grid, and three values of [Ba/Fe] (–0.2, 0.1, and +0.4) for the NLTE correction grid. For each of these values we list in the corresponding table the EWs or corrections calculated for the full set of effective temperature, surface gravity, microturbulent velocity, and metallicity.
Stellar parameters and NLTE barium abundances (grid- and profile-based) for the sample stars.
The grid is also available at the web-site1 together with an interpolation program. The latter enables deriving the absolute barium abundances, namely 12.00 + log ϵ(Ba), by inserting the stellar atmosphere parameters, specifying the line of interest, and its measured equivalent width. If a star has a very anomalous strength of a barium line for the adopted parameters, that is, an anomalous barium abundance that is either lower than [Ba/Fe] = −0.4, or higher than [Ba/Fe] = + 0.6, then the program gives a notification that the expected barium abundance is out of the grid range. In this case, the better way to derive the barium abundance is to apply a direct profile-fitting procedure.
4. Comparing NLTE abundances based on the grid and profile fitting
The most reliable way to derive the NLTE abundance from a given line is to compute an NLTE profile synthesis and fit the observed profile. Nevertheless, this procedure may become complicated when a large amount of stars are to be investigated. A faster, and therefore more efficient, method for analysing large samples of stars is to determine the NLTE abundances by interpolating within a grid of NLTE equivalent widths. Such a grid was presented in Sect. 3. Below we give the results of our grid tests and show which differences between the profile-based and grid-based NLTE abundances can be expected for the stars with different sets of atmosphere parameters and different barium lines.
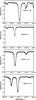 |
Fig. 1 Best NLTE fits for the barium line profiles in the spectrum of HD 010700. Dots denote the observed spectrum, the continuous line the calculated spectrum. The absolute NLTE barium abundances (i.e. log ϵ(Ba) + 12.00) derived from individual lines are indicated in each plot. |
We have selected eight test stars (see Table 2). The spectra of HD stars and their atmospheric parameters are described in Jofre et al. (2014). Similar data for VW Dra can be found in Britavskiy et al. (2012). For these stars we performed the direct NLTE synthesis of the barium line profiles (an example for one star is shown in Fig. 1), and then, using the measured equivalent widths and corresponding atmospheric parameters, we derived the grid-based NLTE barium abundances. The results are presented in Table 2 and are shown in Fig. 2. The 4554 Å line is very strong (even in the intermediate metal-poor stars). In the measurements we therefore underestimate its equivalent widths (far wings are missed). As a result, our grid-based NLTE abundances appear to be systematically lower than abundances derived from the direct profile synthesis. This means that the 4554 Å line has to be excluded from the consideration because it is not appropriate for the grid-based abundance determination (there is the same systematic trend for other lines, although of lesser magnitude). However, this is not a great loss for the future studies in the context of the Gaia-ESO Survey (Gilmore et al. 2012), for example, since this line is not covered by the standard survey wavelength setup, and excluding this line will therefore not have a negative impact on the final Ba abundance. Furthermore, the difference between the direct NLTE line profile fitting and the NLTE grid-based abundances for the 4554 Å line can be as large as ± 0.46 dex (on average ± 0.29 dex). This is larger than the desired abundance uncertainties. This implies that the 4554 Å line should indeed not be used for accurate abundance measurements in more metal-rich stars ([Fe/H] ≳−1). Nevertheless, in faint star spectra that have a low signal-to-noise ratio, only a handful of strong lines are measurable. In this case, even the 4554 Å line may provide (with a corresponding correction) some rough estimate of the barium content.
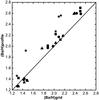 |
Fig. 2 Graphical comparison of the NLTE barium profile-based and grid-based abundances derived from the four lines (asterisks – 4554 Å, circles – 5853 Å, triangles – 6141 Å, squares – 6496 Å) for eight test stars. |
The situation with the other three lines is much more promising. These lines are not too strong, even in the spectra of stars with solar metallicity. In particular, they are weak enough in the metal-poor stars, and this guarantees quite reliable results on barium NLTE abundances derived from the grid. We find an average difference of <± 0.05,0.05,0.08 dex for the 5853, 6141, and 6496 Å line, respectively, between the NLTE profile fitting and the grid Ba abundances. This small difference confirms that the grid abundances are very accurate for these three lines.
5. LTE versus NLTE abundances
Here we present the results of an independent LTE analysis with an NLTE analysis based on a combined use of MULTI and ATLAS9 for the seven stellar spectra described in the previous section. For comparison, the LTE abundances were derived using interpolated MARCS model atmospheres (Gustafsson et al. 2008) and the MOOG spectrum synthesis code (Sneden 1973, version 2014). As mentioned above, the stellar parameters and v sini were adopted from Jofre et al. (2014), and the solar Ba abundance of 2.17 (our NLTE value) was used for this study. The line list compiled for the LTE analysis consists of Ba data from Gallagher et al. (2012), molecular data from Sneden et al. (2014), and most of the remaining atomic data were adopted from the Kurucz database2. All LTE abundances were determined using line synthesis and the interactive minimum χ2 technique in MOOG. The stellar rotation and LTE abundances are listed in Table 3.
Stellar parameters and abundances (LTE and NLTE) from direct profile fitting for the sample stars.
Overall, the LTE and NLTE abundances agree within ≈0.1 dex for these stars (dwarfs and giants of around solar metallicity). The 6496 Å line yields fairly consistent abundances in both LTE and NLTE, when the metallicity is subsolar. Above solar metallicity, larger deviations can occur. The largest difference between the LTE and NLTE abundances is found for the Ba ii line at 6141 Å, which is a blended line (see Fig. 3).
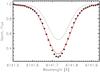 |
Fig. 3 Barium line in HD 18907 at 6141 Å fit in LTE (where [Ba/Fe] = −0.14 is shown as the red, solid line). The core is poorly fit, and the Fe blend is illustrated by the black, dashed line (synthesized with no barium). |
A Fe i line blends into the core of this Ba line. Different values for the log gf of the blending Fe i line translates into small changes in the Ba abundance of the 6141 Å line, and by increasing the log gf of the Fe line by 0.15 dex, the Ba abundance is reduced by 0.02 dex. As seen from Figs. 1–2, we obtain good fits for the 6141 Ba line using the NLTE grid. The smallest difference between the LTE and NLTE abundances is found for the weakest Ba line, which is the 5853 Å line (see Fig. 4). The blue 4554 Å line is saturated or even damped for most of these metal-rich stars and can be affected by uncertainties in the continuum placement (of the order of 0.03 to 0.07 dex in the final Ba abundance). For the red Ba lines the uncertainty from the continuum placement is smaller (± 0.01 − 0.03 dex) in these high-quality spectra.
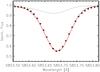 |
Fig. 4 Barium line in HD 10700 at 5853 Å well fit in LTE (the red, solid line has a [Ba/Fe] = −0.18). A weak blend is shown by the black, dashed line (synthesized with no barium). |
The aforementioned differences in Ba abundance obtained independently using MULTI and ATLAS9 models versus MOOG and MARCS hide differences in the synthetic spectrum code, model atmosphere, atomic data, and continuum placement. Therefore, it is not the best ground to compare the LTE and NLTE abundances to assess the size of the ΔNLTE (NLTE−LTE abundance). However, the comparison gives a feeling for how abundance results of two independent studies obtained using completely different tools and methods – only sharing the same high-resolution spectra – can differ. To determine which fraction of the reported ≈0.1 dex in Ba abundance is found between MULTI+ATLAS9 and MOOG+MARCS, we analysed the same star using MOOG+ATLAS9 to assess the abundance difference originating on one hand in the differing model atmospheres and on the other hand in the codes. The average [Ba/Fe] difference between using MOOG+MARCS and MOOG+ATLAS9 is 0.06 dex for all four lines, and the largest difference is found for the 4554 Å line. Meanwhile, the difference in codes result in an average difference of 0.09 dex for all four lines. By adding these values in quadrature, obtain a total abundance difference of 0.11 dex, which agrees with the aforementioned difference. We note that differences in the continuum placement were not taken into account, and the individual (atmosphere vs. code) differences may therefore only be ≈0.05 dex.
The determined LTE barium abundances can be corrected using our NLTE corrections listed in the grid. In Figs. A.1–A.4 we show how these corrections depend upon the effective temperature, gravity, metallicity, and relative barium-to-iron abundance. An idea on how the corrections depend on the microturbulent velocity can be obtained by comparing Figs. A.2 and A.4.
All these figures can give a preliminary idea about the necessity to apply corrections for a given range of the stellar fundamental parameters.
6. Conclusion
Barium is a key element in the context of stellar evolution and Galactic chemical evolution. The determination of its abundance has implications on the evolution of AGB stars, on the origin of heavy elements in globular clusters, on the role of spinstars, and on supernovae ejecta. Therefore, it is important to derive its abundance in stars in a reliable way that is based on the modern NLTE approach.
We presented a grid of NLTE equivalent widths of the Ba ii lines 4554, 5853, 6141, and 6496 Å that is intended for the barium abundance determination in cool dwarf, giant, and supergiant stars of metallicities from −2.0 to +0.5. The bluest 4554 Å line is hard to fit in LTE, and the NLTE grid-abundance for this line deviates by up to 0.46 dex compared to its NLTE profile fitting. Our tests showed that this line is not suitable for accurate abundance analyses in stars with metallicities higher than [Fe/H] = −1. By comparing LTE and NLTE abundances, it can be seen that the LTE fits for the weaker 5853 Å line tend to yield LTE abundances close to the NLTE ones, and that the difference between the LTE and NLTE abundance for three red Ba lines is on average ± 0.1 dex. However, in several cases, even at the higher metallicities, the ΔNLTE is larger than this value, and NLTE corrections should be applied. Such corrections are also included in the grid. We showed that the most reliable NLTE grid-based barium abundances can be derived using the equivalent widths of three lines: 5853, 6141, and 6496 Å. We plan to use this grid in the Gaia-ESO spectroscopic survey. However, it can generally also be used by spetroscopists working with elemental abundance analysis, no matter how large the samples are that they work with.
Online material
Appendix A: Additional figures
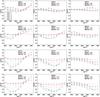 |
Fig. A.1 NLTE corrections (Δ(NLTE) = NLTE – LTE) for the four barium lines as a function of effective temperature for the different gravities, metallicities, and values [Ba/Fe] = –0.3. The gravity values are listed in the lower left corner of the upper plot. The adopted microturbulent velocity is 2 km s-1. |
Acknowledgments
S.A.K. and S.M.A. acknowledge the SCOPES grant No. IZ73Z0-152485 for financial support. S.M.A. is thankful to the GEPI Department and Paris Observatoire administration for their hospitality during his visit and to CNRS for the financial support. C.J.H. was supported by a research grant (VKR023371) from VILLUM FONDEN. E.C. is grateful to the FONDATION MERAC for funding her fellowship. The authors are thankful to the referee for their comments.
References
- Andrievsky, S. M., Spite, M., Korotin, S. A., et al. 2009, A&A, 494, 1083 [NASA ADS] [CrossRef] [EDP Sciences] [Google Scholar]
- Andrievsky, S. M., Kovtyukh, V. V., Wallerstein, G., Korotin, S. A., & Huang, W. 2010, PASP, 122, 877 [NASA ADS] [CrossRef] [Google Scholar]
- Andrievsky, S. M., Lépine, J. R. D., Korotin, S. A., et al. 2013, MNRAS, 428, 3252 [NASA ADS] [CrossRef] [Google Scholar]
- Andrievsky, S. M., Luck, R. E., & Korotin, S. A. 2014, MNRAS, 437, 2106 [NASA ADS] [CrossRef] [Google Scholar]
- Bisterzo, S., Gallino, R., Straniero, O., Cristallo, S., & Kappeler, F. 2010, MNRAS, 404, 1529 [NASA ADS] [Google Scholar]
- Britavskiy, N. E., Andrievsky, S. M., Korotin, S. A., & Martin, P. 2010, A&A, 519, A74 [NASA ADS] [CrossRef] [EDP Sciences] [Google Scholar]
- Britavskiy, N. E., Andrievsky, S. M., Tsymbal, V. V., et al. 2012, A&A, 542, A104 [NASA ADS] [CrossRef] [EDP Sciences] [Google Scholar]
- Busso, M., Gallino, R., & Wasserburg, G. J. 1999, ARA&A, 37, 239 [NASA ADS] [CrossRef] [Google Scholar]
- Cameron, A. G. W. 1982, Ap&SS, 82, 123 [NASA ADS] [CrossRef] [Google Scholar]
- Carlsson, M. 1986, Uppsala Obs. Rep., 33 [Google Scholar]
- Castelli, F., & Kurucz, R. L. 2003, in Modeling of Stellar Atmospheres, eds. N. E. Piskunov, W. W. Weiss, & D. F. Gray, Proc. IAU Symp., 210, poster A20 (CD-ROM), synthetic spectra available at http://cfaku5.cfa.harvard.edu/grids [Google Scholar]
- Christlieb, N., Beers, T. C., Barklem, P. S., et al. 2004, A&A, 428, 1027 [NASA ADS] [CrossRef] [EDP Sciences] [Google Scholar]
- Cristallo, S., Piersanti, L., Straniero, O., et al. 2011, ApJS, 197, 17 [NASA ADS] [CrossRef] [Google Scholar]
- Dobrovolskas, V., Kucinskas, A., Andrievsky, S. M., et al. 2012, A&A, 540, A128 [NASA ADS] [CrossRef] [EDP Sciences] [Google Scholar]
- D’Orazi, V., Biazzo, K., Desidera, S., et al. 2012, MNRAS, 423, 2789 [NASA ADS] [CrossRef] [Google Scholar]
- Gallagher, A. J., Ryan, S. G., Hosford, A., et al. 2012, A&A, 538, A118 [NASA ADS] [CrossRef] [EDP Sciences] [Google Scholar]
- Gilmore, G., Randich, S., Asplund, M., et al. 2012, The Messenger, 147, 25 [NASA ADS] [Google Scholar]
- Gustafsson, B., Edvardsson, B., Eriksson, K., et al. 2008, A&A, 486, 951 [NASA ADS] [CrossRef] [EDP Sciences] [Google Scholar]
- Hansen, C. J., Nordström, B., & Bonifacio, P. 2011, A&A, 527, A65 [NASA ADS] [CrossRef] [EDP Sciences] [Google Scholar]
- Hansen, C. J., Primas, F., Hartman, H., et al. 2012, A&A, 545, A31 [NASA ADS] [CrossRef] [EDP Sciences] [Google Scholar]
- Jofre, P., Heiter, U., Soubiran, C., et al. 2014, A&A, 564, A133 [NASA ADS] [CrossRef] [EDP Sciences] [Google Scholar]
- Karakas, A. I., & Lattanzio, J. C. 2014, PASA, 31, 30 [Google Scholar]
- Klochkova, V., Mishenina, T., Korotin, S., et al. 2011a, Ap&SS, 335, 141 [NASA ADS] [CrossRef] [Google Scholar]
- Klochkova, V. G., Mishenina, T. V., Panchuk, V. E., et al. 2011b, Astrophys. Bull., 66, 28 [NASA ADS] [CrossRef] [Google Scholar]
- Korotin, S. A., Andrievsky, S. M., & Luck, R. E. 1999, A&A, 351, 168 [NASA ADS] [Google Scholar]
- Korotin, S., Mishenina, T., Gorbaneva, T., & Soubiran, C. 2010, Proc. 11th Symp. on Nuclei in the Cosmos, http://pos.sissa.it/cgi-bin/reader/conf.cgi?confid=100 [Google Scholar]
- Korotin, S., Mishenina, T., Gorbaneva, T., & Soubiran, C. 2011, MNRAS, 415, 2093 [NASA ADS] [CrossRef] [Google Scholar]
- Mashonkina, L., Gehren, T., & Bikmaev, I. 1999, A&A, 343, 519 [NASA ADS] [Google Scholar]
- Mishenina, T. V., Kucinskas, A., Andrievsky, S. M., et al. 2009, Balt. Astron., 18, 193 [NASA ADS] [Google Scholar]
- Mishenina, T. V., Soubiran, C., Korotin, S. A., Gorbaneva, T. I., & Basak, N. Yu. 2012, EPJ Web Conf., 19, 05006 [CrossRef] [EDP Sciences] [Google Scholar]
- Mishenina, T., Korotin, S., Carraro, G., Kovtyukh, V. V., & Yegorova, I. A. 2013a, MNRAS, 433, 1436 [NASA ADS] [CrossRef] [Google Scholar]
- Mishenina, T. V., Korotin, S. A., Yegorova, I. A., Kovtukh, V. V., & Carraro, G. 2013b, Bull. Crimean Astrophys. Obs., 109, 32 [NASA ADS] [CrossRef] [Google Scholar]
- Mishenina, T. V., Pignatari, M., Korotin, S. A., et al. 2013c, A&A, 552, A128 [NASA ADS] [CrossRef] [EDP Sciences] [Google Scholar]
- Mishenina, T. V., Kovtyukh, V. V., Yegorova, I. A., Korotin, S. A., & Carraro, G. 2014a, Mem. Soc. Astron. It., 85, 295 [NASA ADS] [Google Scholar]
- Mishenina, T., Pignatari, M., Carraro, G., et al. 2014b, ArXiv e-prints [arXiv:1411.1422] [Google Scholar]
- Rutten, R. J. 1978, Sol. Phys., 56, 237 [NASA ADS] [CrossRef] [Google Scholar]
- Sneden, C. 1973, Ph.D. Thesis, 35, 28 [Google Scholar]
- Sneden, C., Lucatello, S., Ram, R. S., Brooke, J. A. S., & Bernath, P. 2014, ApJS, 214, 26 [Google Scholar]
- Thygesen, A. O., Sbordone, L., Andrievsky, S., et al. 2014, A&A, 572, 108 [Google Scholar]
All Tables
Stellar parameters and NLTE barium abundances (grid- and profile-based) for the sample stars.
Stellar parameters and abundances (LTE and NLTE) from direct profile fitting for the sample stars.
All Figures
|
Fig. 1 Best NLTE fits for the barium line profiles in the spectrum of HD 010700. Dots denote the observed spectrum, the continuous line the calculated spectrum. The absolute NLTE barium abundances (i.e. log ϵ(Ba) + 12.00) derived from individual lines are indicated in each plot. |
| In the text | |
|
Fig. 2 Graphical comparison of the NLTE barium profile-based and grid-based abundances derived from the four lines (asterisks – 4554 Å, circles – 5853 Å, triangles – 6141 Å, squares – 6496 Å) for eight test stars. |
| In the text | |
|
Fig. 3 Barium line in HD 18907 at 6141 Å fit in LTE (where [Ba/Fe] = −0.14 is shown as the red, solid line). The core is poorly fit, and the Fe blend is illustrated by the black, dashed line (synthesized with no barium). |
| In the text | |
|
Fig. 4 Barium line in HD 10700 at 5853 Å well fit in LTE (the red, solid line has a [Ba/Fe] = −0.18). A weak blend is shown by the black, dashed line (synthesized with no barium). |
| In the text | |
|
Fig. A.1 NLTE corrections (Δ(NLTE) = NLTE – LTE) for the four barium lines as a function of effective temperature for the different gravities, metallicities, and values [Ba/Fe] = –0.3. The gravity values are listed in the lower left corner of the upper plot. The adopted microturbulent velocity is 2 km s-1. |
| In the text | |
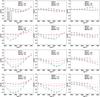 |
Fig. A.2 Same as Fig. A.1 for [Ba/Fe] = 0. |
| In the text | |
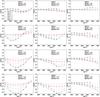 |
Fig. A.3 Same as Fig. A.1 for [Ba/Fe] = +0.3. |
| In the text | |
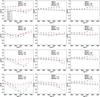 |
Fig. A.4 Same as Fig. A.1, but for [Ba/Fe] = 0 and a microturbulent velocity of 0 km s-1. |
| In the text | |
Current usage metrics show cumulative count of Article Views (full-text article views including HTML views, PDF and ePub downloads, according to the available data) and Abstracts Views on Vision4Press platform.
Data correspond to usage on the plateform after 2015. The current usage metrics is available 48-96 hours after online publication and is updated daily on week days.
Initial download of the metrics may take a while.