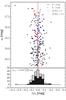
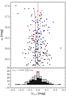
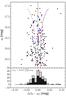
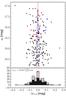
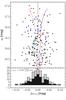
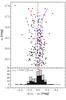
Fig. 9

Upper panels: colour magnitude diagrams of y0 vs. δ4, cy,0, (b − y)0, c1,0, m0 and (u − y)0, respectively, where the colours were detrended by subtracting a ridge line polynomial (for δ4 this is shown in Fig. 8). Symbols as in Fig. 8. The purple lines demonstrate the differential effect of He enhancement by ΔY = 0.15. They correspond to 13 Gyr, [Fe/H] = −2 dex, [α/Fe] = +0.4 dex Dartmouth isochrones, with Y = 0.25 (solid purple line) and Y = 0.40 (dashed purple line), respectively, from which the average colour at a given magnitude has been subtracted. The cyan vertical lines around y0 = 18.3 mag show the expected difference between C-normal, N-poor (dashed line) and C-normal, N-rich stars (dotted line) with MV = −1 mag taken from Carretta et al. (2011). Lower panels: histograms of the colour distribution of all stars in the clean RGB sample (light histograms) and of stars with 17.2 <y0< 19 mag (dark histograms). The intrinsic spreads σintr obtained by assuming a Gaussian intrinsic distribution are reported and illustrated by the red errorbars above the histograms.
Current usage metrics show cumulative count of Article Views (full-text article views including HTML views, PDF and ePub downloads, according to the available data) and Abstracts Views on Vision4Press platform.
Data correspond to usage on the plateform after 2015. The current usage metrics is available 48-96 hours after online publication and is updated daily on week days.
Initial download of the metrics may take a while.