Fig. 6
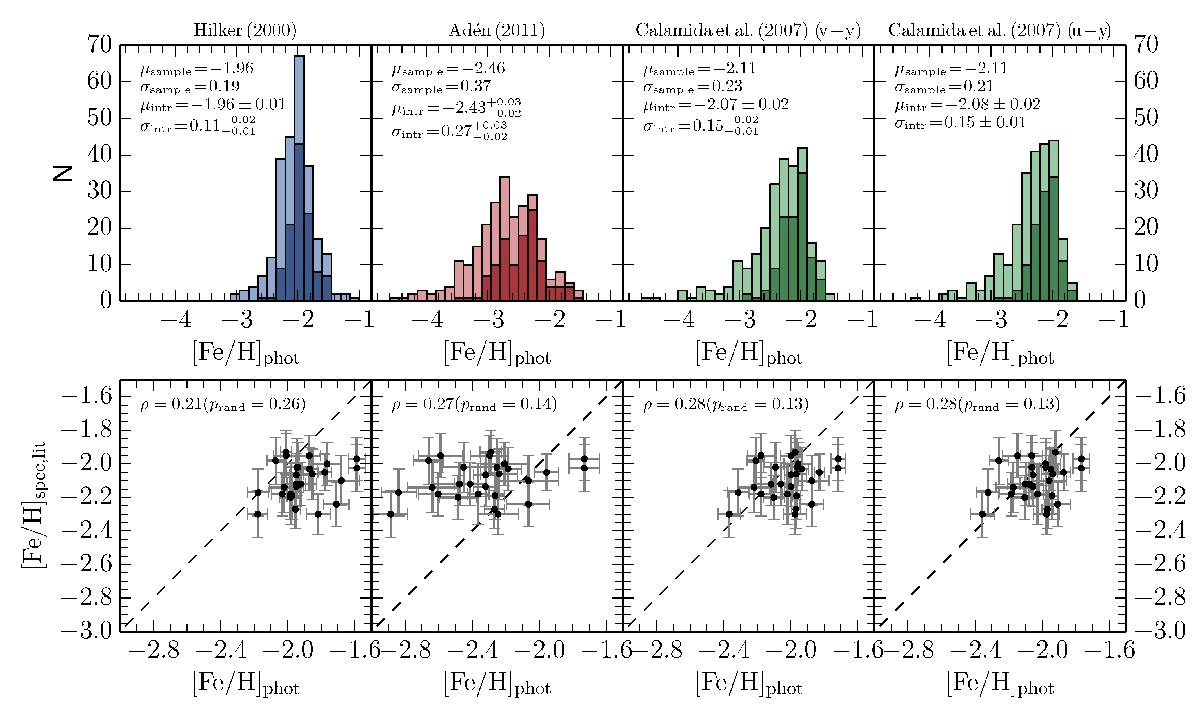
Photometric metallicity distributions (upper panels) and comparison with spectroscopic measurements (lower panels). From left to right, the photometric metallicities were obtained using Eqs. (2), (5), (3), and (4). Light histograms in the upper panels show the entire clean RGB star sample, dark histograms show only stars with y0< 19 mag. Each panel in the upper row reports, for the brighter subsample (y0< 19 mag), the sample mean μsample and standard deviation σsample, as well as the intrinsic mean μintr and dispersion σintr obtained via Eq. (8).
Current usage metrics show cumulative count of Article Views (full-text article views including HTML views, PDF and ePub downloads, according to the available data) and Abstracts Views on Vision4Press platform.
Data correspond to usage on the plateform after 2015. The current usage metrics is available 48-96 hours after online publication and is updated daily on week days.
Initial download of the metrics may take a while.