Fig. 4
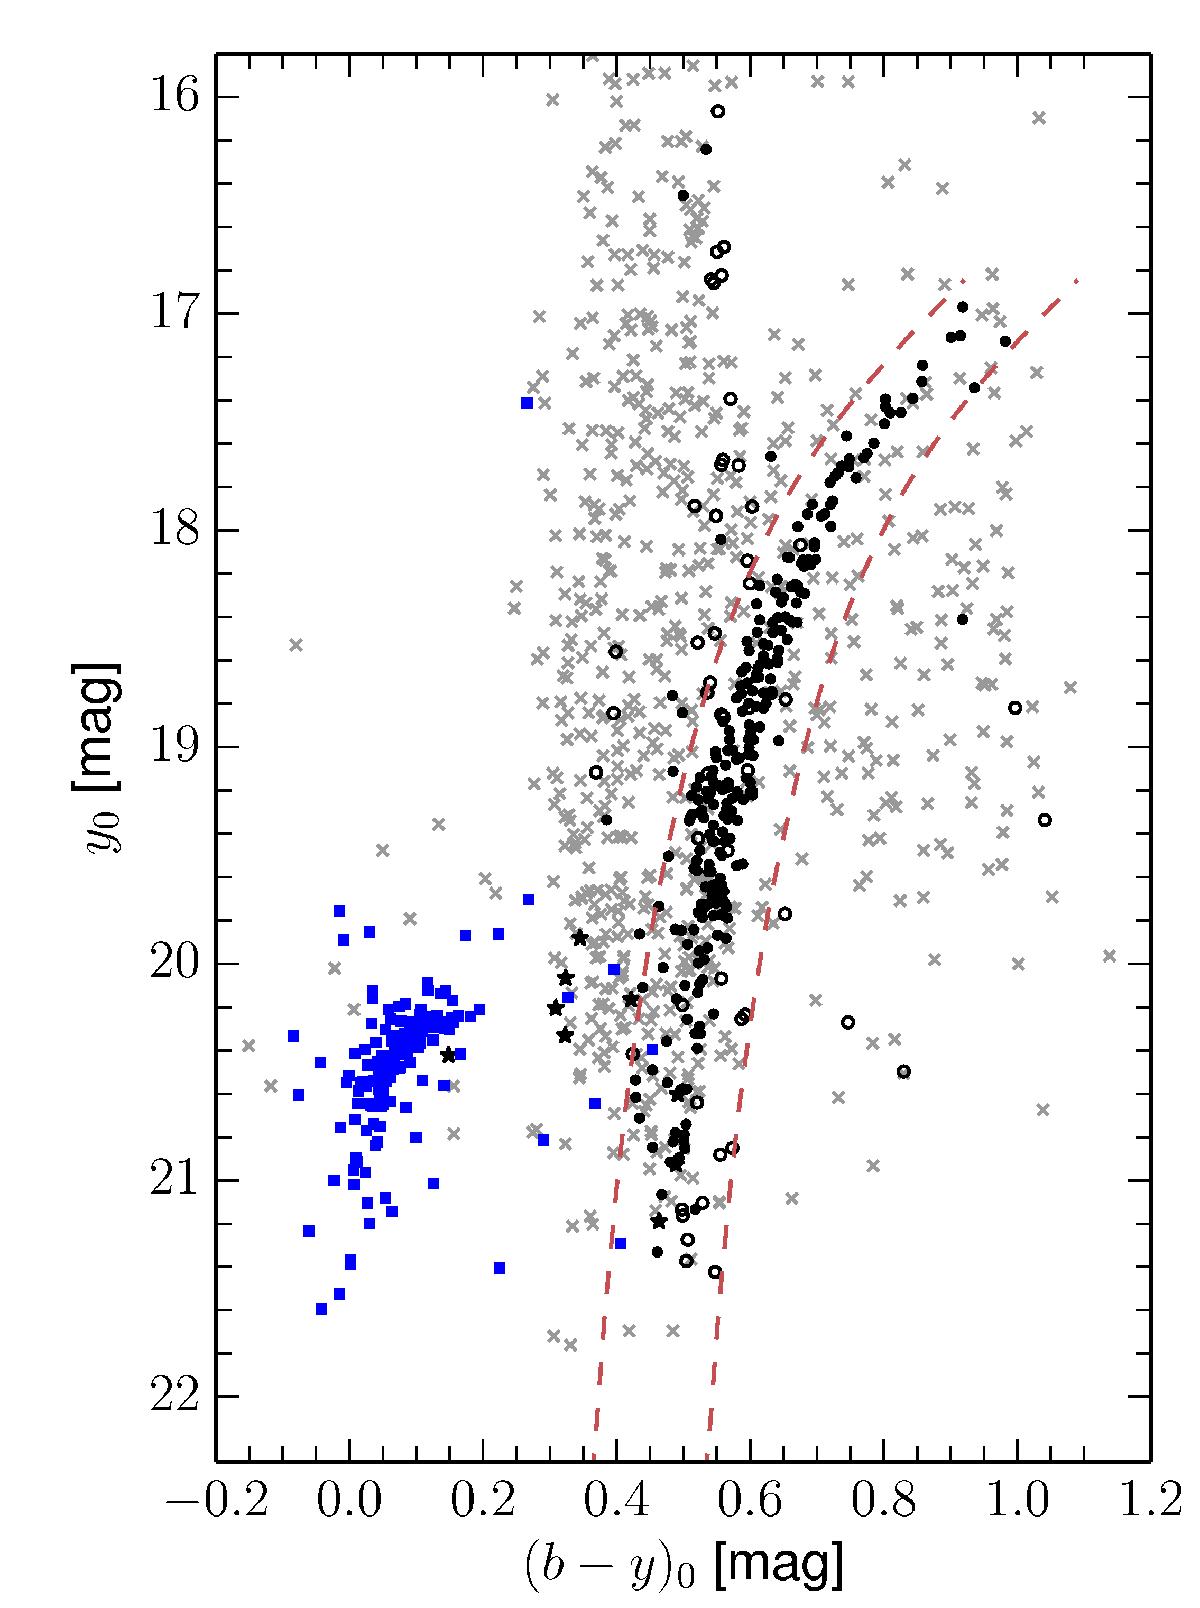
y0 vs. (b − y)0 colour–magnitude diagram with symbols as in Fig. 2. It is apparent that the selection of candidate cluster members in the c1 and m1 vs. (b − y) colour–colour diagrams (Figs. 2 and 3) is very efficient. To obtain a clean sample of RGB stars we use an additional CMD-based selection indicated by the red dashed lines. These were obtained by shifting a 13 Gyr, [Fe/H] = −2 dex, [α/Fe] = 0.4 dex Dartmouth isochrone from its best-fitting location by –0.04 and 0.13 mag along the colour axis in order to eliminate several AGB star candidates, as well as a handful of foreground and background contaminants.
Current usage metrics show cumulative count of Article Views (full-text article views including HTML views, PDF and ePub downloads, according to the available data) and Abstracts Views on Vision4Press platform.
Data correspond to usage on the plateform after 2015. The current usage metrics is available 48-96 hours after online publication and is updated daily on week days.
Initial download of the metrics may take a while.