Fig. 2
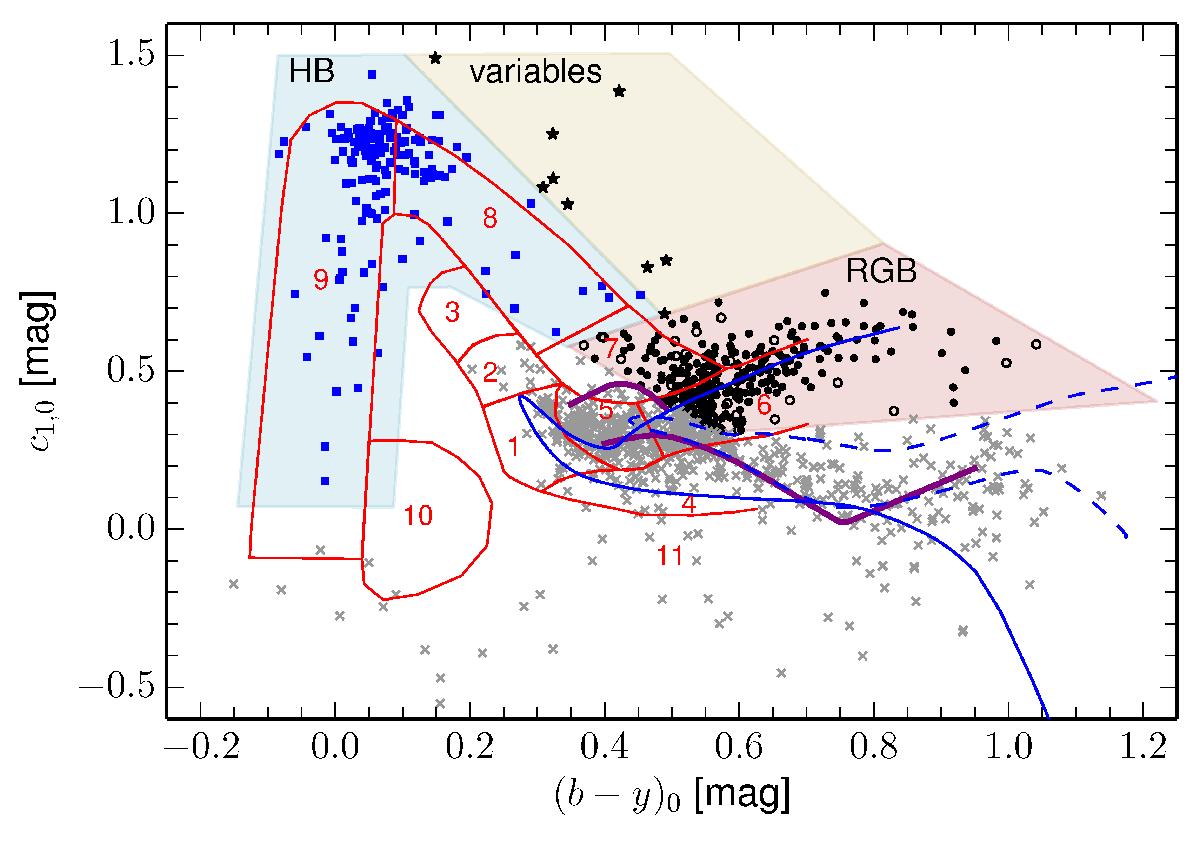
Surface-gravity-sensitive c1,0 index vs. (b − y)0 of objects in our catalogue. Different symbols represent likely cluster RGB/AGB stars (filled circles), candidate RGB/AGB stars that do not fulfil the metallicity selection (open circles; see Fig. 3), likely cluster HB stars (filled blue squares), likely cluster variable stars (filled star symbols), and foreground contaminants as well as background galaxies (grey crosses; see text). Shaded regions indicate the selection boxes for RGB (red), HB (blue), and variable stars (yellow). Superimposed are the empirical dwarf star sequence for [Fe/H] = 0 dex (lower purple line) and the upper envelope of dwarf stars in the solar neighbourhood (upper purple line) derived by Árnadóttir et al. (2010), as well as 13 Gyr Dartmouth isochrones for [Fe/H] = 0 dex (blue dashed line) and [Fe/H] = −2 dex. Thin red lines delineate the loci of different stages in the evolution of metal-poor stars and were adopted from Fig. 6 of Schuster et al. (2004). The regions correspond to: (1) turn-off stars, (2) blue straggler/turn-off transition, (3) blue stragglers, (4) main sequence, (5) subgiant stars, (6) RGB stars, (7) red HB/AGB transition, (8) HB, (9) blue HB, (10) subluminous/blue HB transition, (11) subluminous stars.
Current usage metrics show cumulative count of Article Views (full-text article views including HTML views, PDF and ePub downloads, according to the available data) and Abstracts Views on Vision4Press platform.
Data correspond to usage on the plateform after 2015. The current usage metrics is available 48-96 hours after online publication and is updated daily on week days.
Initial download of the metrics may take a while.