Fig. 11
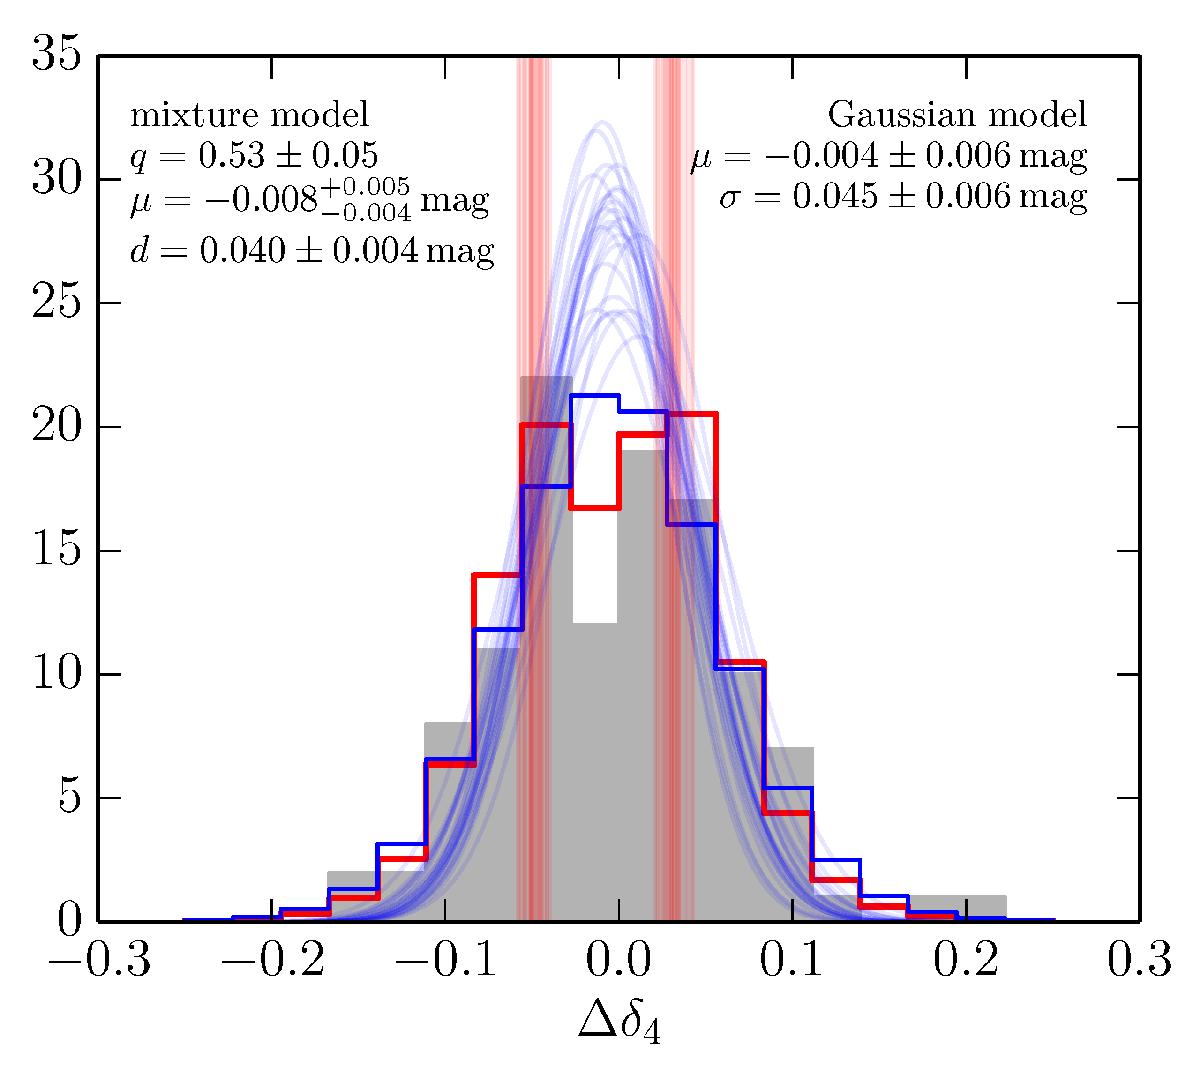
Observed distribution of the ridge-line-detrended δ4 index for stars brighter than y0 = 19 mag (grey histogram) and two different models for the intrinsic distribution. Red vertical lines represent a sampling from the posterior pdf of the location of the two populations with no intrinsic spread in the mixture model (Eq. (10)). Blue transparent curves show a sampling from the posterior pdf of the intrinsic Gaussian distribution model. Best-fitting values for the parameters of each model in terms of the median of the posterior and 68 per cent credible intervals are shown at the top. The solid red and blue lines correspond to the best respective models convolved with the photometric uncertainties and integrated over the bins of the histogram. A leave-one-out cross-validation to quantify which model fits better yields relative odds of ~5.1 to one for the mixture and Gaussian models (see text).
Current usage metrics show cumulative count of Article Views (full-text article views including HTML views, PDF and ePub downloads, according to the available data) and Abstracts Views on Vision4Press platform.
Data correspond to usage on the plateform after 2015. The current usage metrics is available 48-96 hours after online publication and is updated daily on week days.
Initial download of the metrics may take a while.