Fig. 1
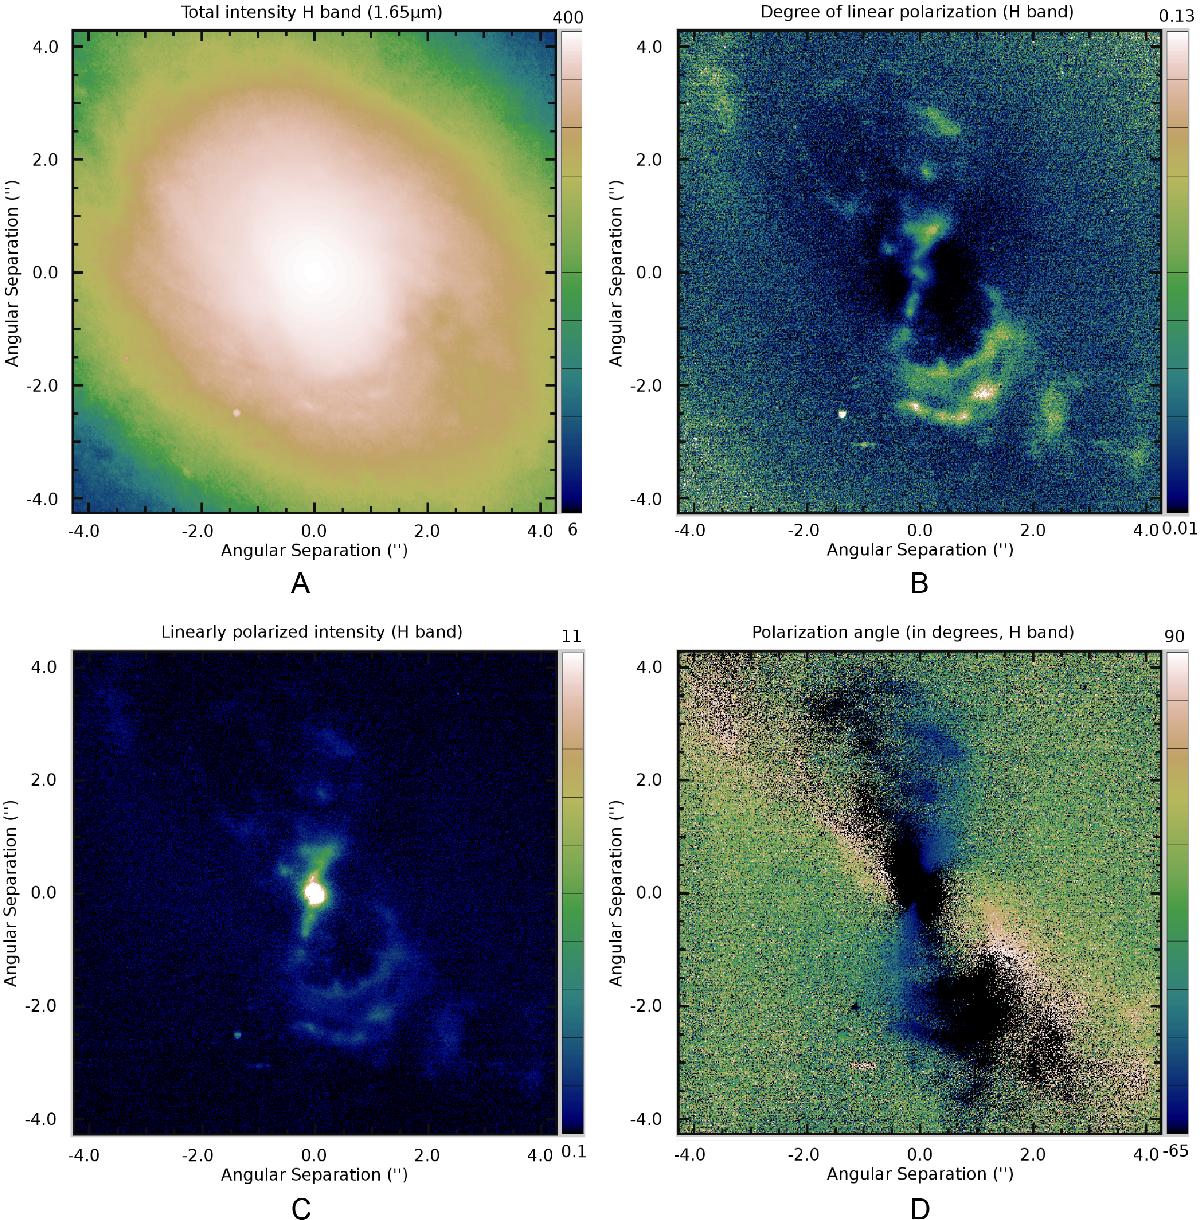
Output of our data reduction pipeline. North is up, east to the left. A) Total intensity image (color bar in arbitrary units); B) degree of linear polarization; C) polarized intensity (color bar in arbitrary units); D) polarization angle (in degrees). The total intensity image has been histogram-equalized between the 2 values in the color bar; i.e., each byte in the color map occurs with equal frequency between the 2 specified values.
Current usage metrics show cumulative count of Article Views (full-text article views including HTML views, PDF and ePub downloads, according to the available data) and Abstracts Views on Vision4Press platform.
Data correspond to usage on the plateform after 2015. The current usage metrics is available 48-96 hours after online publication and is updated daily on week days.
Initial download of the metrics may take a while.