Fig. 4
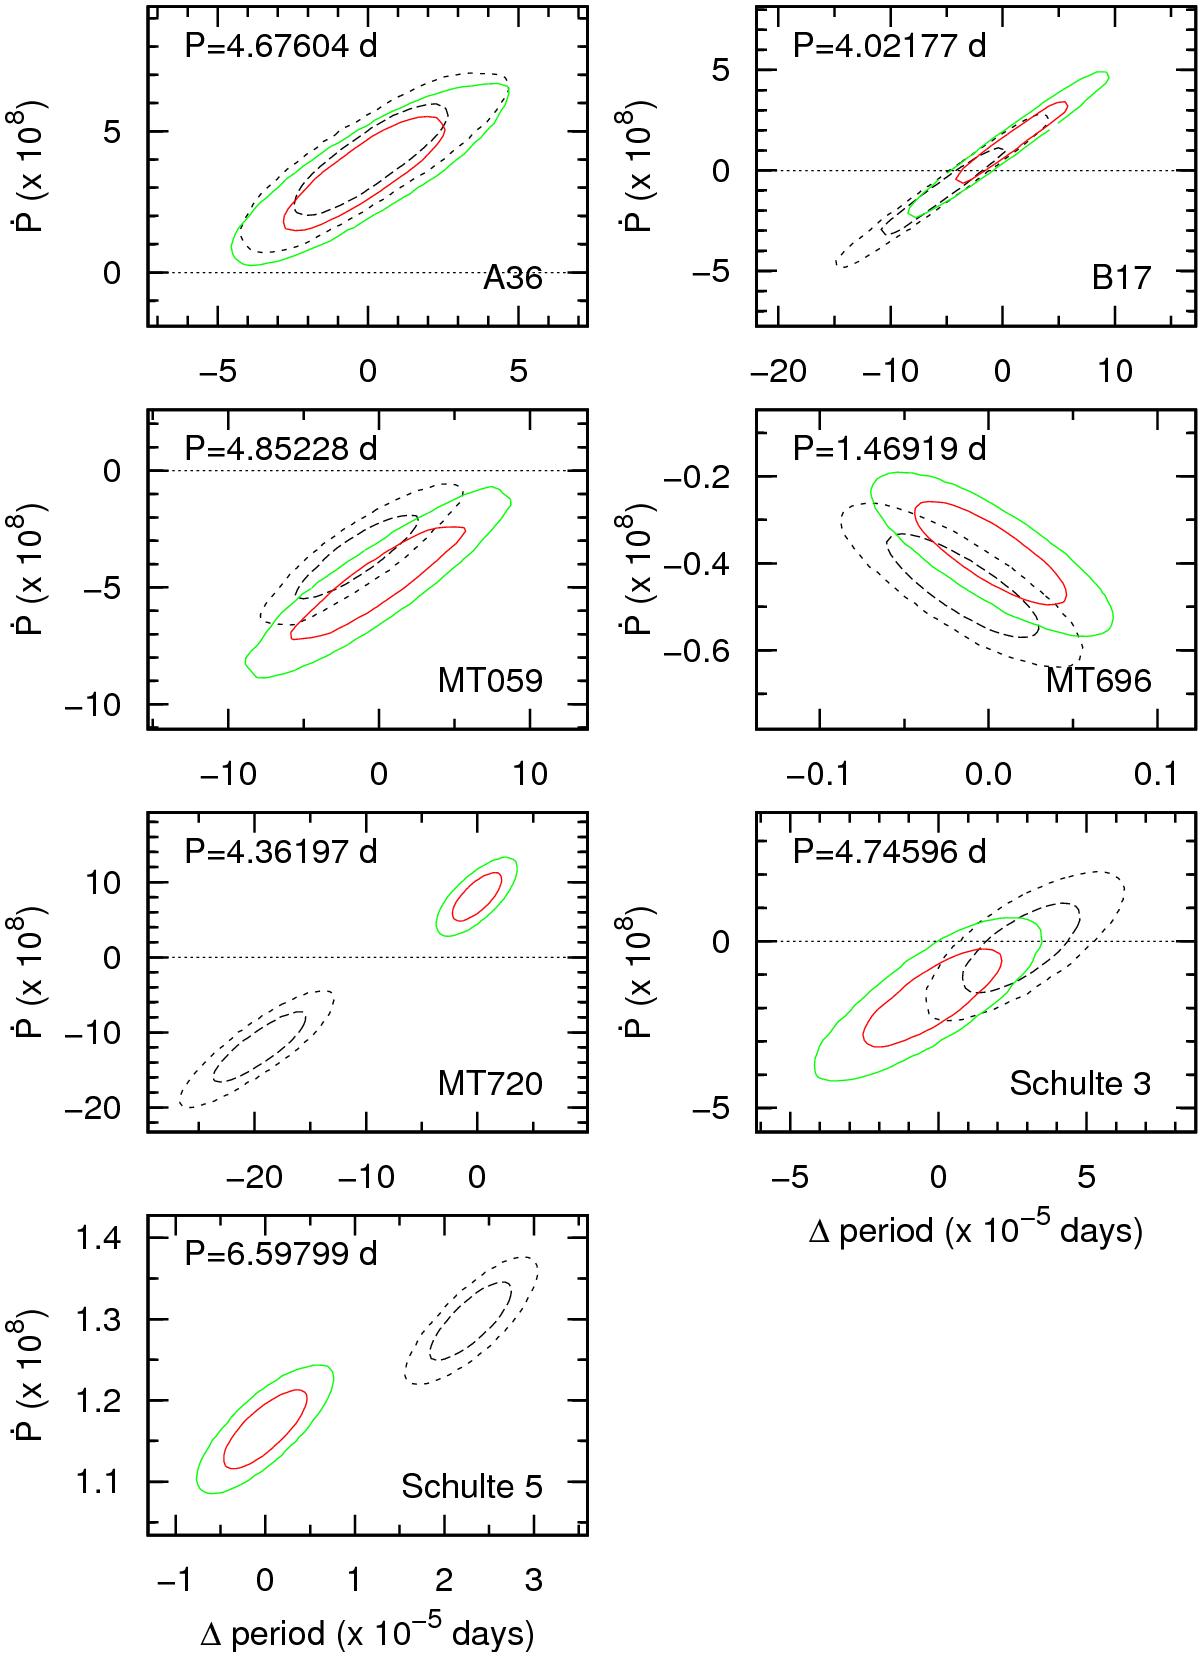
Parameter estimates for period and period change. Periods are given as a difference from the Pemp value (see Table 2). The coloured solid line represents the results for an empirical phase model, and the dashed line represents the results for the calculated PHOEBE phase model. The inner contour is the 68% and outer contour is the 95% confidence level.
Current usage metrics show cumulative count of Article Views (full-text article views including HTML views, PDF and ePub downloads, according to the available data) and Abstracts Views on Vision4Press platform.
Data correspond to usage on the plateform after 2015. The current usage metrics is available 48-96 hours after online publication and is updated daily on week days.
Initial download of the metrics may take a while.