Free Access
Fig. 3
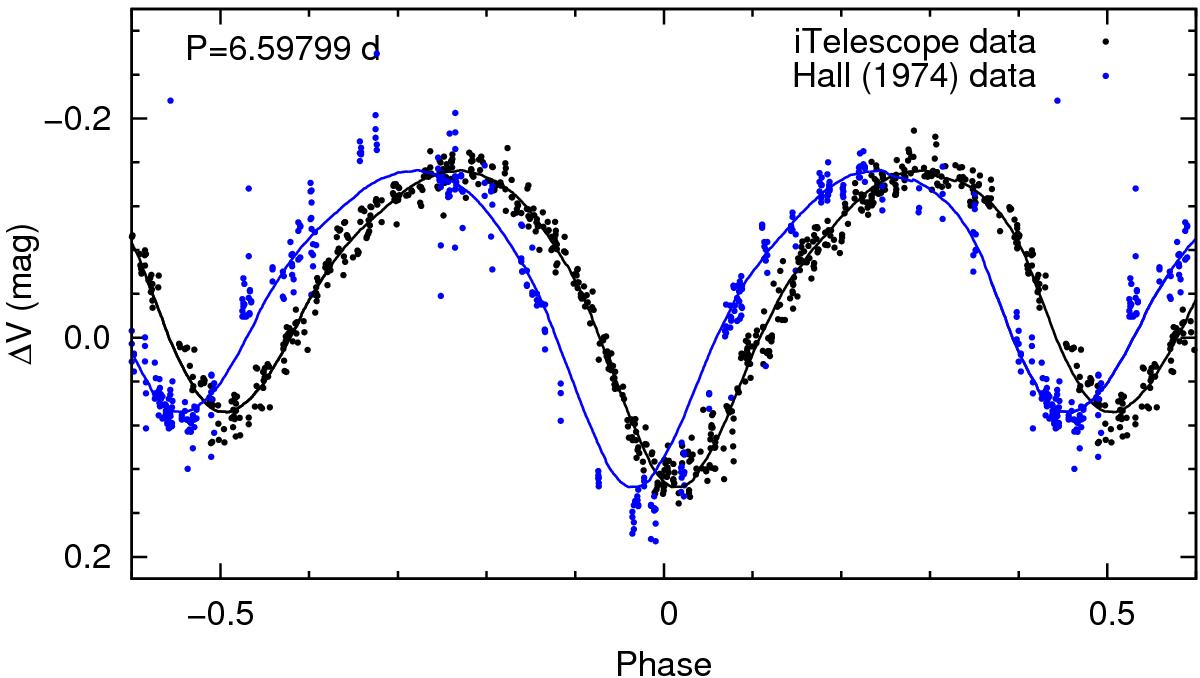
V-filter phase diagram of Schulte 5, folded with a constant period. The iTelescope data (black points) and Hall (1974) data (blue points) have been obtained 45 years apart. Solid lines are smoothed empirical light curves. The visible phase shift is due to the cumulative effect of period change (Ṗ).
Current usage metrics show cumulative count of Article Views (full-text article views including HTML views, PDF and ePub downloads, according to the available data) and Abstracts Views on Vision4Press platform.
Data correspond to usage on the plateform after 2015. The current usage metrics is available 48-96 hours after online publication and is updated daily on week days.
Initial download of the metrics may take a while.