Free Access
Fig. A.6
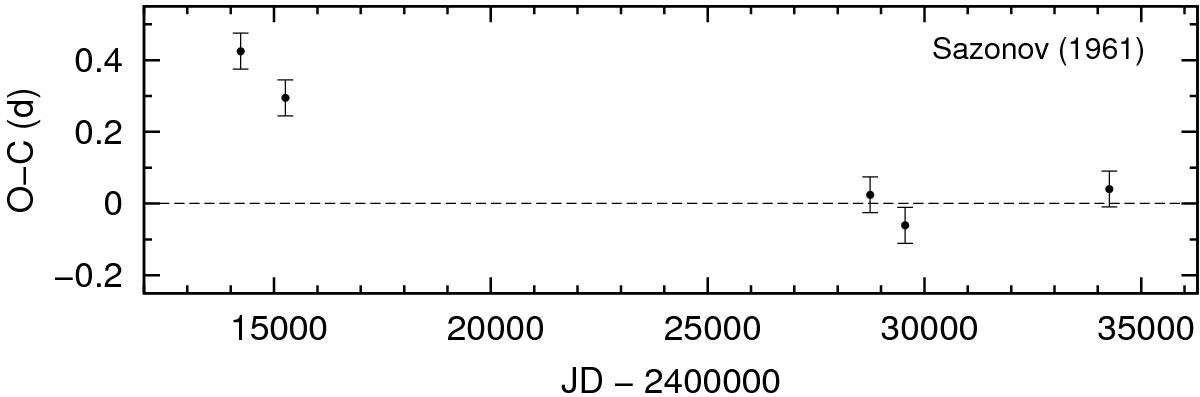
O−C diagram for Schulte 5. Points denote the time difference between the observed times of minimum and the calculated times of minimum using the Pemp and Ṗemp from Table 2. Dashed line shows the O−C value of zero.
Current usage metrics show cumulative count of Article Views (full-text article views including HTML views, PDF and ePub downloads, according to the available data) and Abstracts Views on Vision4Press platform.
Data correspond to usage on the plateform after 2015. The current usage metrics is available 48-96 hours after online publication and is updated daily on week days.
Initial download of the metrics may take a while.