Fig. A.1
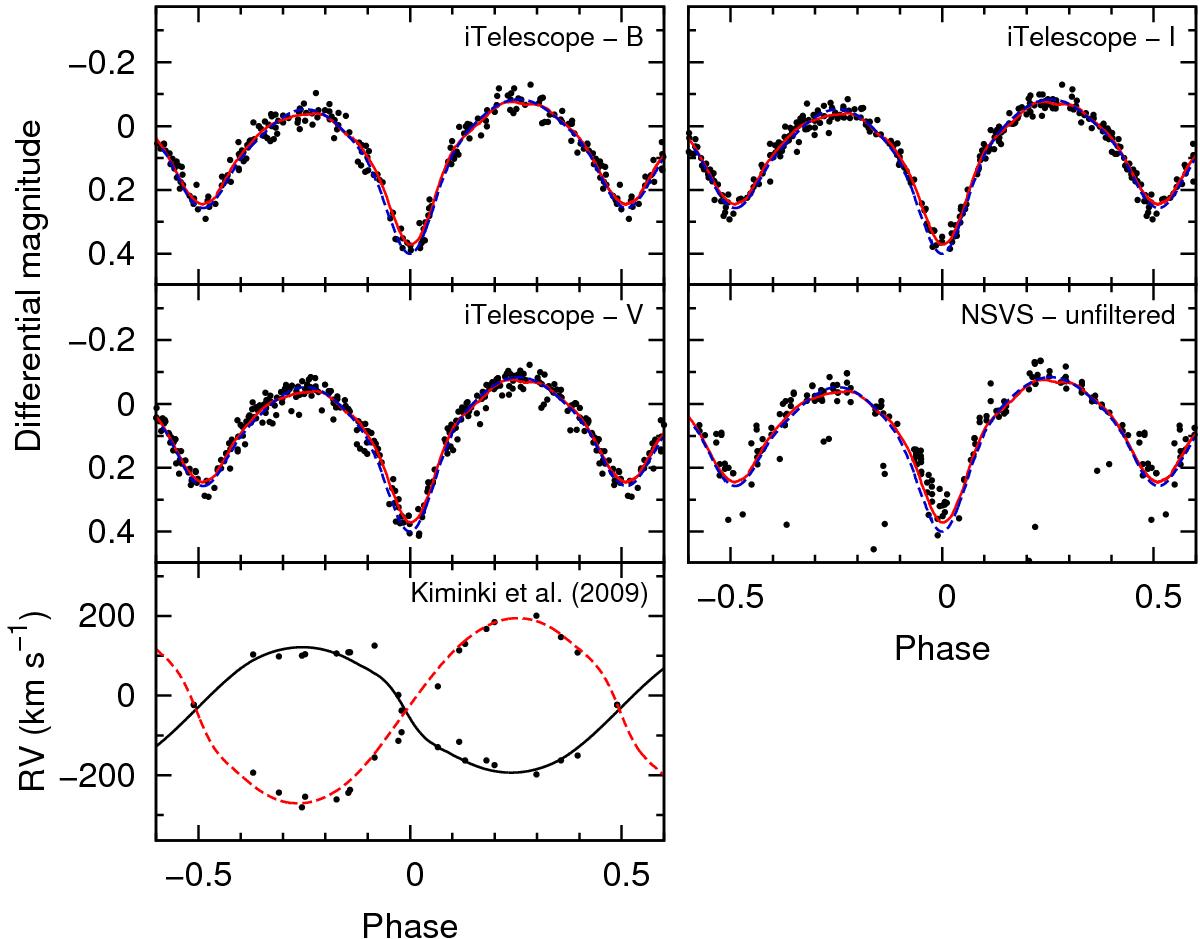
Phase diagrams for A36 using the Pemp and Ṗemp from Table 2. Blue dashed lines in the magnitude plots denote a model light curve from PHOEBE software, and the red solid lines denote an empirical light curve. The solid line in the RV plot represents the model for the primary component, and the red dashed line represents the model for the secondary component.
Current usage metrics show cumulative count of Article Views (full-text article views including HTML views, PDF and ePub downloads, according to the available data) and Abstracts Views on Vision4Press platform.
Data correspond to usage on the plateform after 2015. The current usage metrics is available 48-96 hours after online publication and is updated daily on week days.
Initial download of the metrics may take a while.