Free Access
Fig. 5
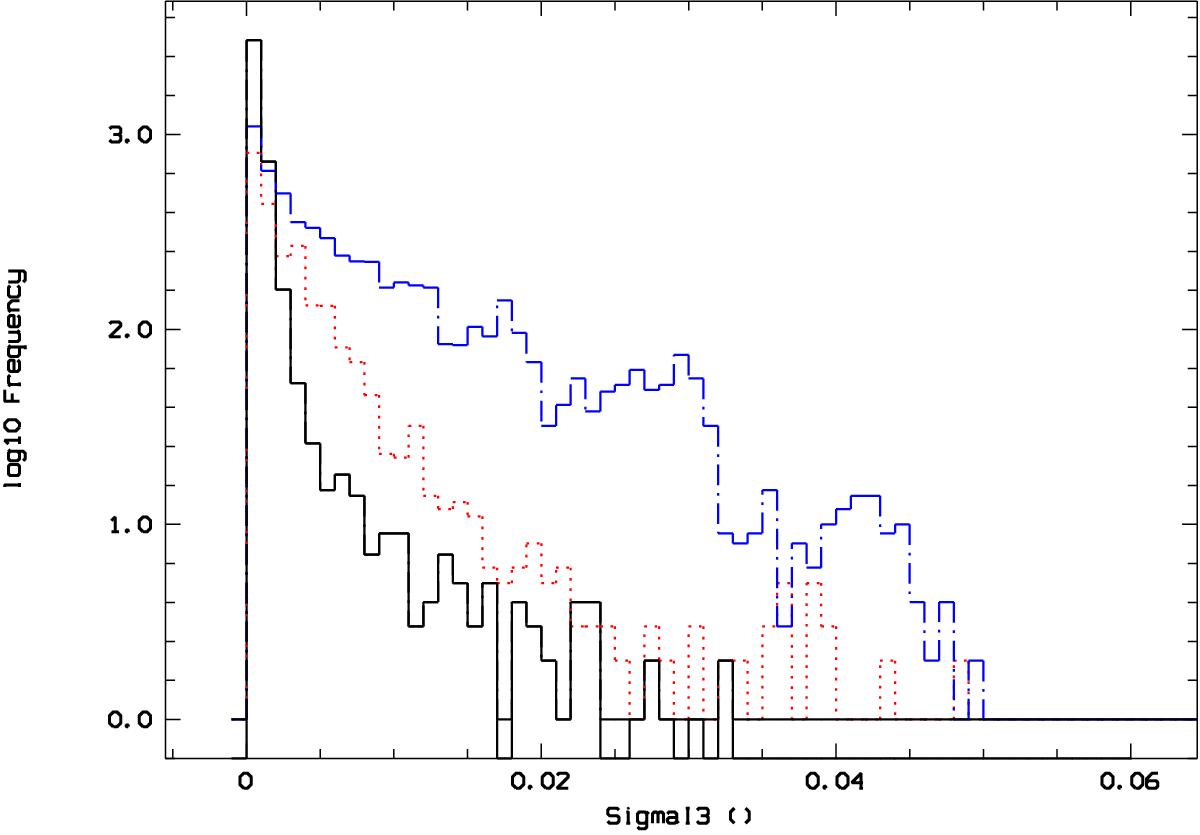
Histograms of I3 dispersion along orbits for zmax intervals delimited by 0, 1000 pc, 2000 pc, and beyond (respectively black, dotted red, dashed blue lines). For each of the three zmax intervals, the medians of σI3 are respectively 5 × 10⁻⁴, 1.5 × 10⁻³, and 5 × 10⁻³.
Current usage metrics show cumulative count of Article Views (full-text article views including HTML views, PDF and ePub downloads, according to the available data) and Abstracts Views on Vision4Press platform.
Data correspond to usage on the plateform after 2015. The current usage metrics is available 48-96 hours after online publication and is updated daily on week days.
Initial download of the metrics may take a while.