Fig. 3
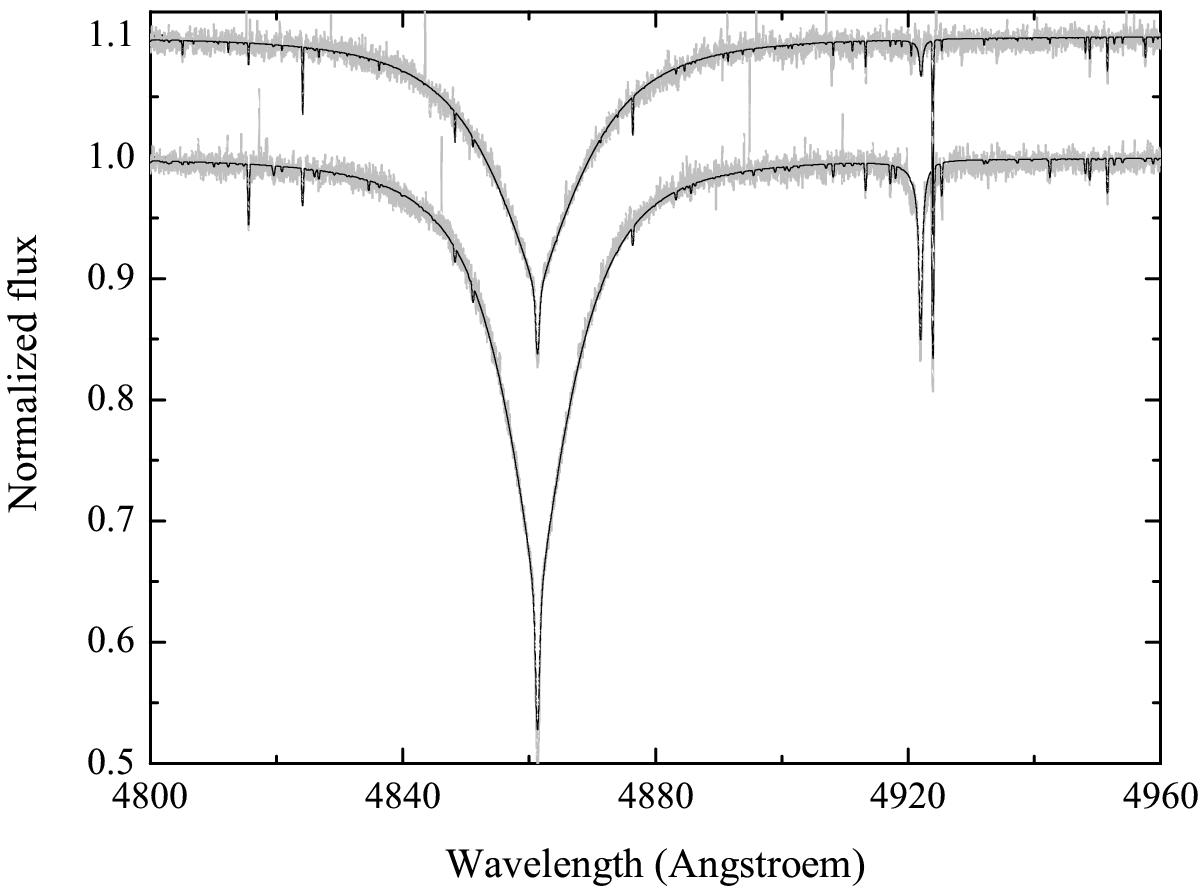
Comparison between the observed disentangled spectra (light grey lines) of both stellar components of the KIC 4931738 system and the best fit synthetic spectra (black lines) computed with the gssp_single software module. The spectrum of the secondary was vertically shifted by a constant value for better visualization.
Current usage metrics show cumulative count of Article Views (full-text article views including HTML views, PDF and ePub downloads, according to the available data) and Abstracts Views on Vision4Press platform.
Data correspond to usage on the plateform after 2015. The current usage metrics is available 48-96 hours after online publication and is updated daily on week days.
Initial download of the metrics may take a while.