Fig. 5
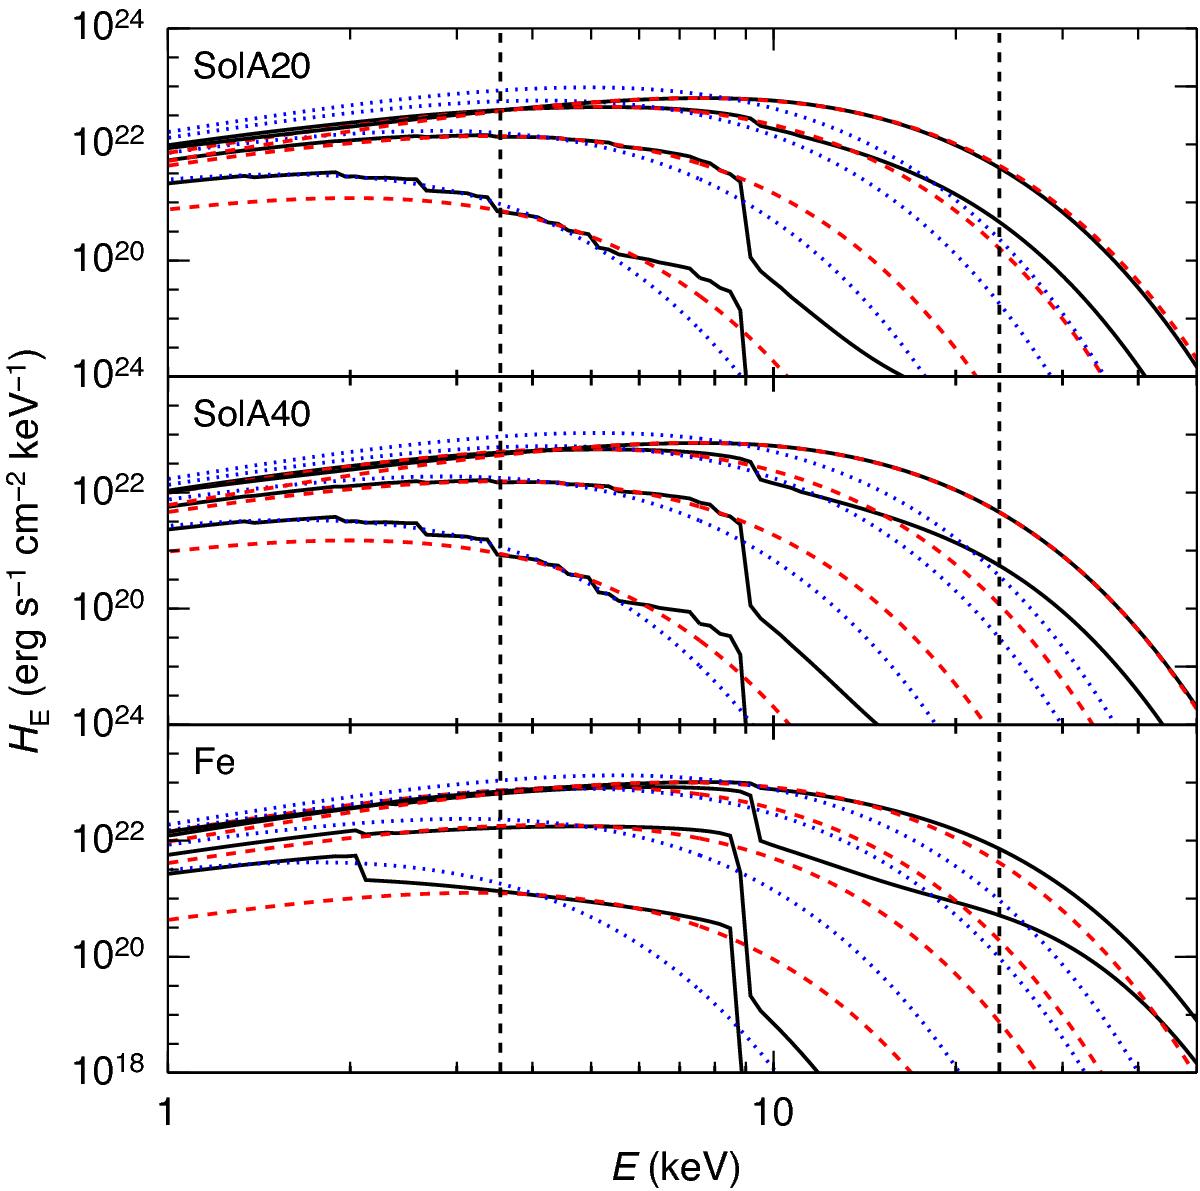
Emergent spectra (black, solid line) for different relative luminosities of ℓ = 0.01, 0.1, 0.5 and 1.0 for compositions of the solar ratio of H/He with Z = 20 Z⊙ (upper panel) and Z = 40 Z⊙ (middle panel); and pure iron (bottom panel) for log g = 14.0 is shown. Best-fit diluted blackbody function (red, dashed line) is also shown together with a blackbody function where Tbb = Teff (blue, dotted line). Vertical dashed lines correspond to the observed (3−20) × (1 + z) keV range where the fitting is performed.
Current usage metrics show cumulative count of Article Views (full-text article views including HTML views, PDF and ePub downloads, according to the available data) and Abstracts Views on Vision4Press platform.
Data correspond to usage on the plateform after 2015. The current usage metrics is available 48-96 hours after online publication and is updated daily on week days.
Initial download of the metrics may take a while.