Fig. 6
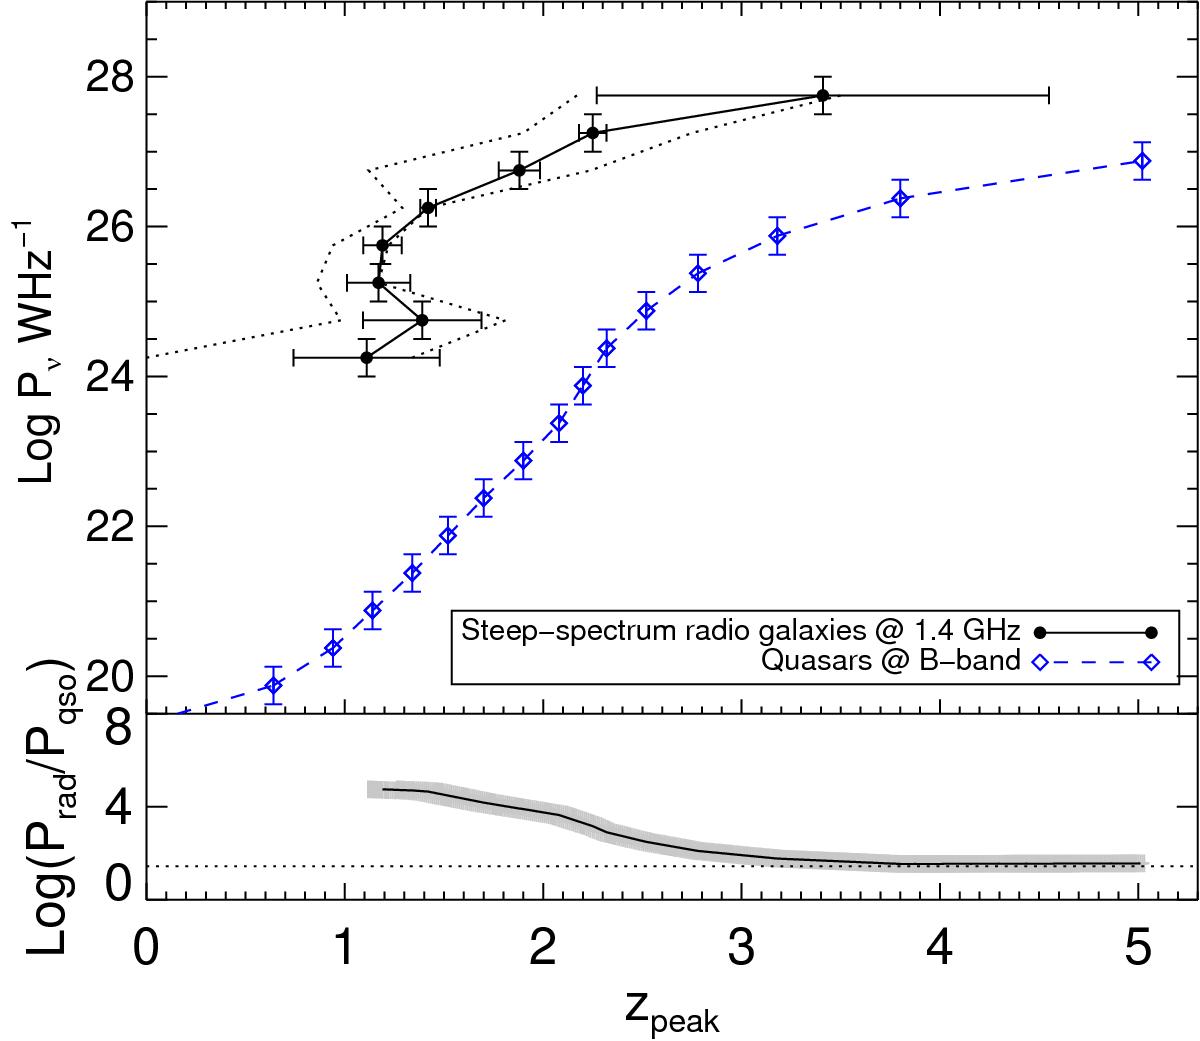
Comparison of the variation of the redshift of the space density peak with radio luminosity (steep-spectrum sources, black solid line; the uncertainty range arising from the assumed spectral index is indicated by dotted lines) and B-band luminosity (quasars, blue dashed line). The subplot shows the ratio between the two luminosities as a function of zpeak. The dotted line here indicates a constant ratio of log (P1.4 GHz/PB − band) = 1.5, the minimum value historically adopted when classifying a source as radio-loud (Kellermann et al. 1989).
Current usage metrics show cumulative count of Article Views (full-text article views including HTML views, PDF and ePub downloads, according to the available data) and Abstracts Views on Vision4Press platform.
Data correspond to usage on the plateform after 2015. The current usage metrics is available 48-96 hours after online publication and is updated daily on week days.
Initial download of the metrics may take a while.