Fig. 5
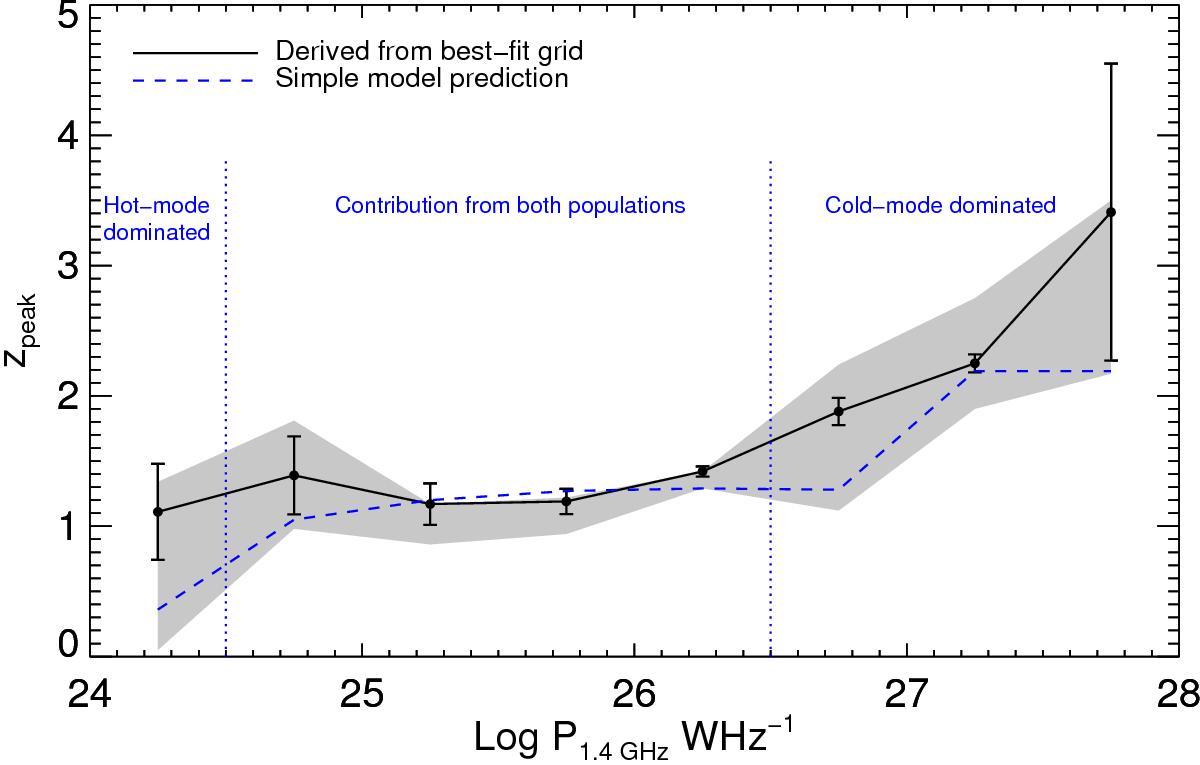
Variation in the redshift of the peak space density with radio power for the best-fitting steep spectrum grid determined here (black line), compared with that predicted using the simple model described in Sect. 5.2 (blue line). Dotted lines delineate the relative contributions to the latter from the two underlying populations. The error bars show the uncertainty in the polynomial fits used to determine the peak position, whilst the shaded region represents the range in results found from varying the input parameters used in the RLF grid modelling.
Current usage metrics show cumulative count of Article Views (full-text article views including HTML views, PDF and ePub downloads, according to the available data) and Abstracts Views on Vision4Press platform.
Data correspond to usage on the plateform after 2015. The current usage metrics is available 48-96 hours after online publication and is updated daily on week days.
Initial download of the metrics may take a while.