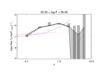
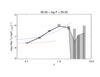
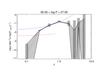
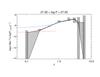
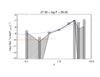
Fig. 3
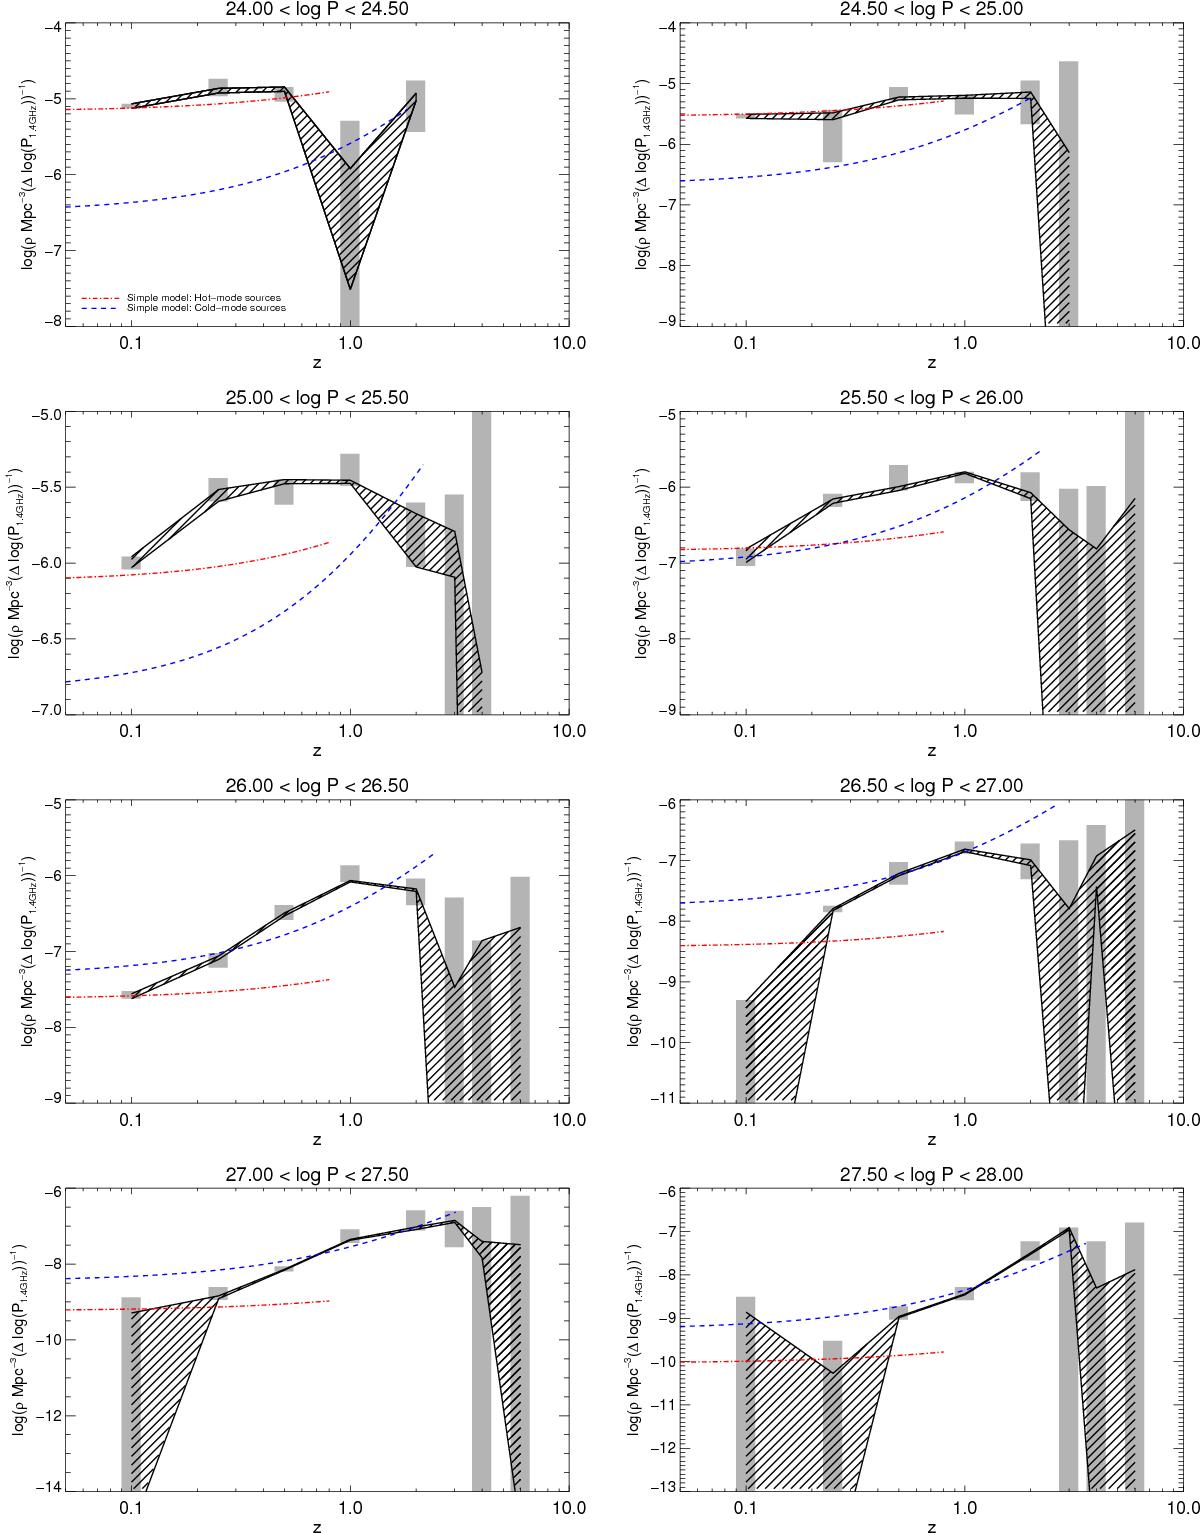
Model steep-spectrum RLFs as a function of redshift from the best-fitting P-z grid (black shaded region). Results are only plotted if they are constrained by at least two of the input datasets (Fig. 1). Dark grey shaded regions show the spread in results from varying the assumed value of the spectral index. Dotted and dashed lines show the predictions of the simple RLF model described in Sect. 5.2 for the hot-mode and cold-mode populations, respectively (for clarity plotted up to the peak redshift value only). The brightest RLFs (log P> 26) were fully constrained previously, and are therefore unchanged from R11. They are reproduced here for completeness and comparison with the simple RLF model.
Current usage metrics show cumulative count of Article Views (full-text article views including HTML views, PDF and ePub downloads, according to the available data) and Abstracts Views on Vision4Press platform.
Data correspond to usage on the plateform after 2015. The current usage metrics is available 48-96 hours after online publication and is updated daily on week days.
Initial download of the metrics may take a while.