Free Access
Fig. 1
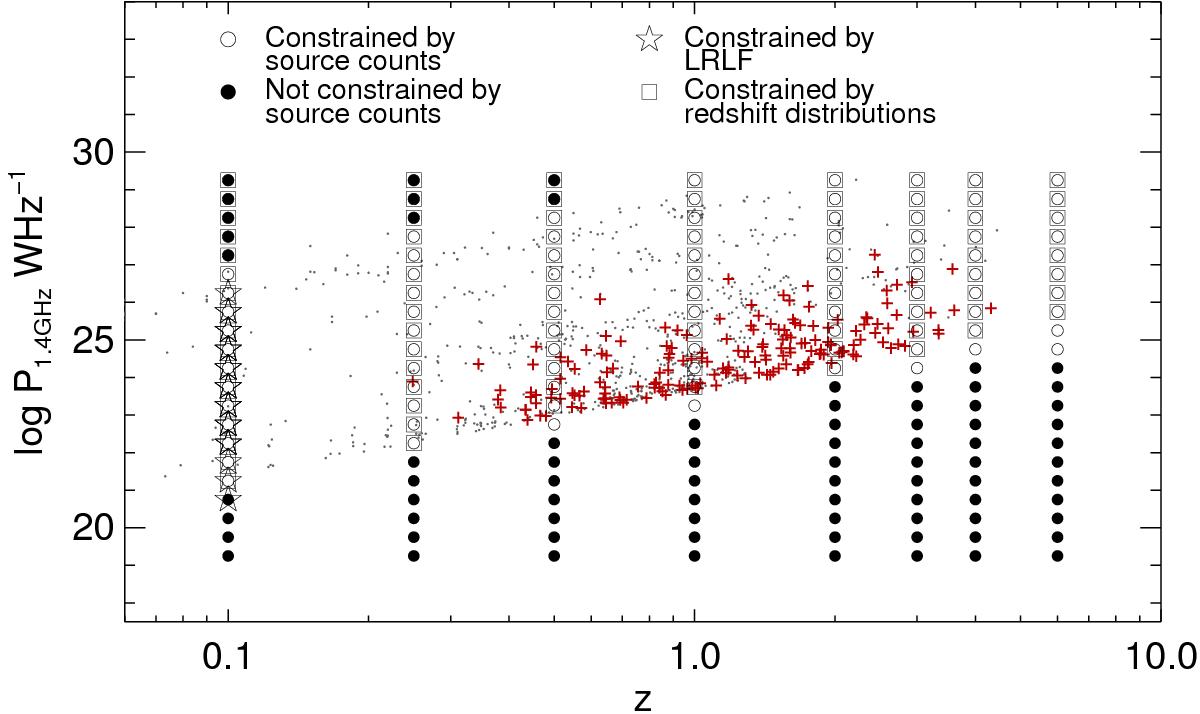
Distribution of grid points in the P-z plane; the constraints offered by the three different types of input are highlighted. Grey dots show the positions of the individual sources in the four original radio source samples taken from R11. The sources in the new SXDF sample are indicated by red crosses.
Current usage metrics show cumulative count of Article Views (full-text article views including HTML views, PDF and ePub downloads, according to the available data) and Abstracts Views on Vision4Press platform.
Data correspond to usage on the plateform after 2015. The current usage metrics is available 48-96 hours after online publication and is updated daily on week days.
Initial download of the metrics may take a while.