Free Access
Fig. 7
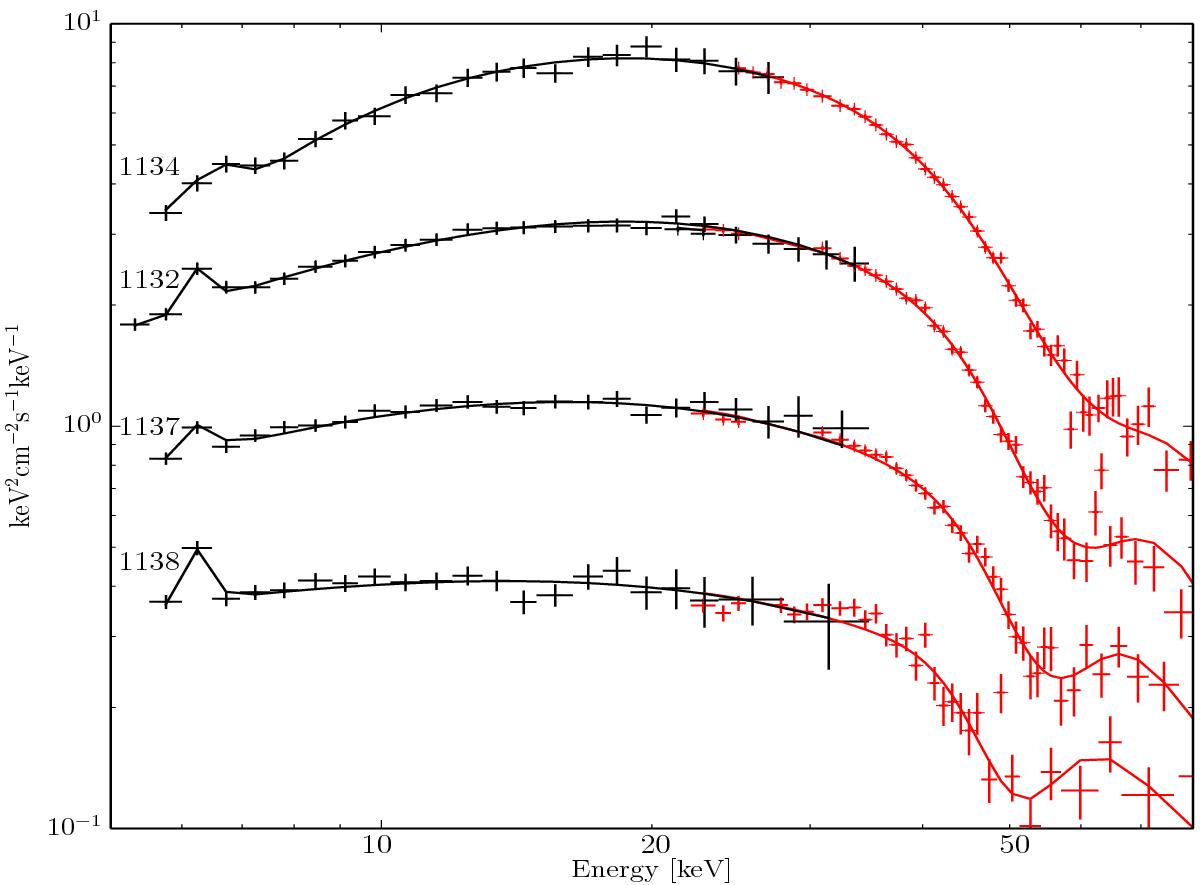
Phase-averaged spectra of four observations (labelled above each spectrum), from top to bottom, with decreasing luminosity. JEM-X1 (black) and ISGRI (red) data and folded model are shown. Spectra have been scaled for better visualization. Both the Ecyc–flux and the Γ–flux correlations are clearly visible.
Current usage metrics show cumulative count of Article Views (full-text article views including HTML views, PDF and ePub downloads, according to the available data) and Abstracts Views on Vision4Press platform.
Data correspond to usage on the plateform after 2015. The current usage metrics is available 48-96 hours after online publication and is updated daily on week days.
Initial download of the metrics may take a while.