Free Access
Fig. 4
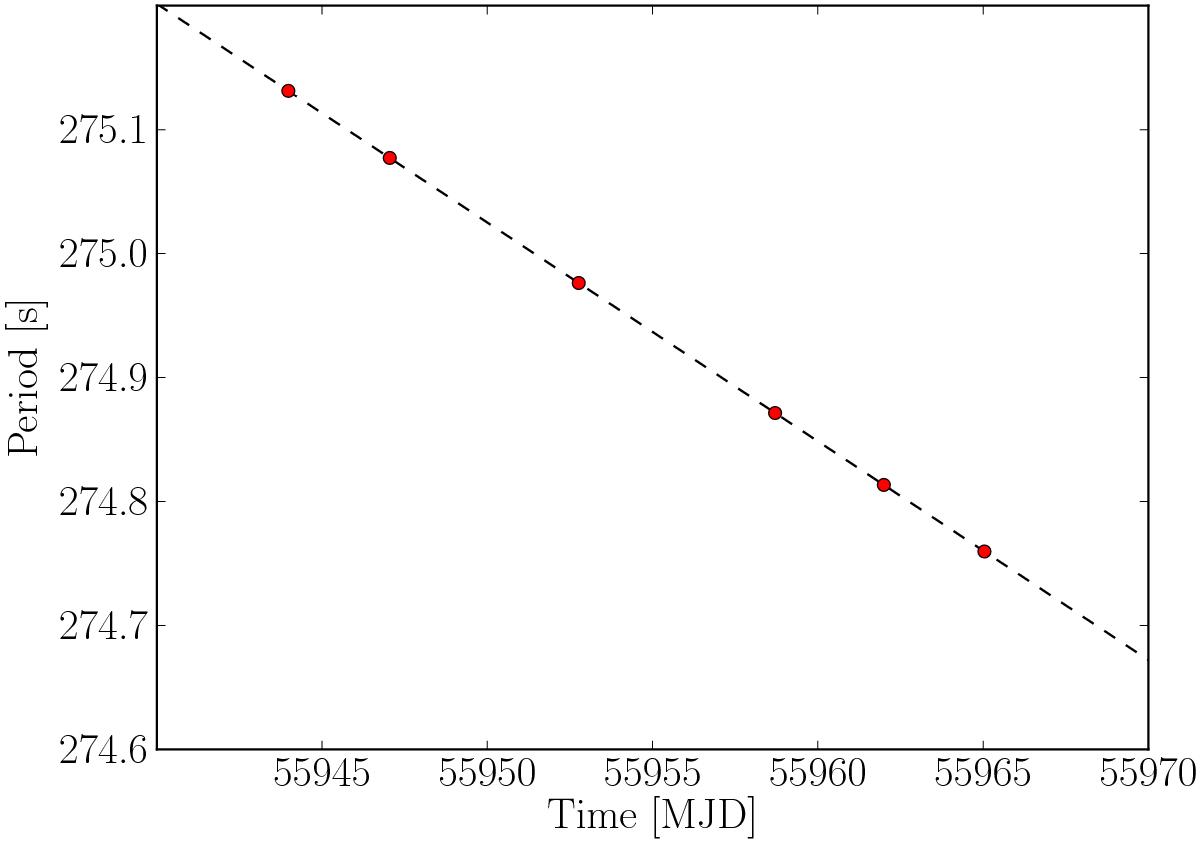
Pulse period as a function of time obtained by phase connection. The dashed line represents a linear fit to the data points, yielding a pulse period derivative of Ṗ = (−2.04 ± 0.01) × 10-7. The period error bars are smaller than the symbols.
Current usage metrics show cumulative count of Article Views (full-text article views including HTML views, PDF and ePub downloads, according to the available data) and Abstracts Views on Vision4Press platform.
Data correspond to usage on the plateform after 2015. The current usage metrics is available 48-96 hours after online publication and is updated daily on week days.
Initial download of the metrics may take a while.