Fig. 2
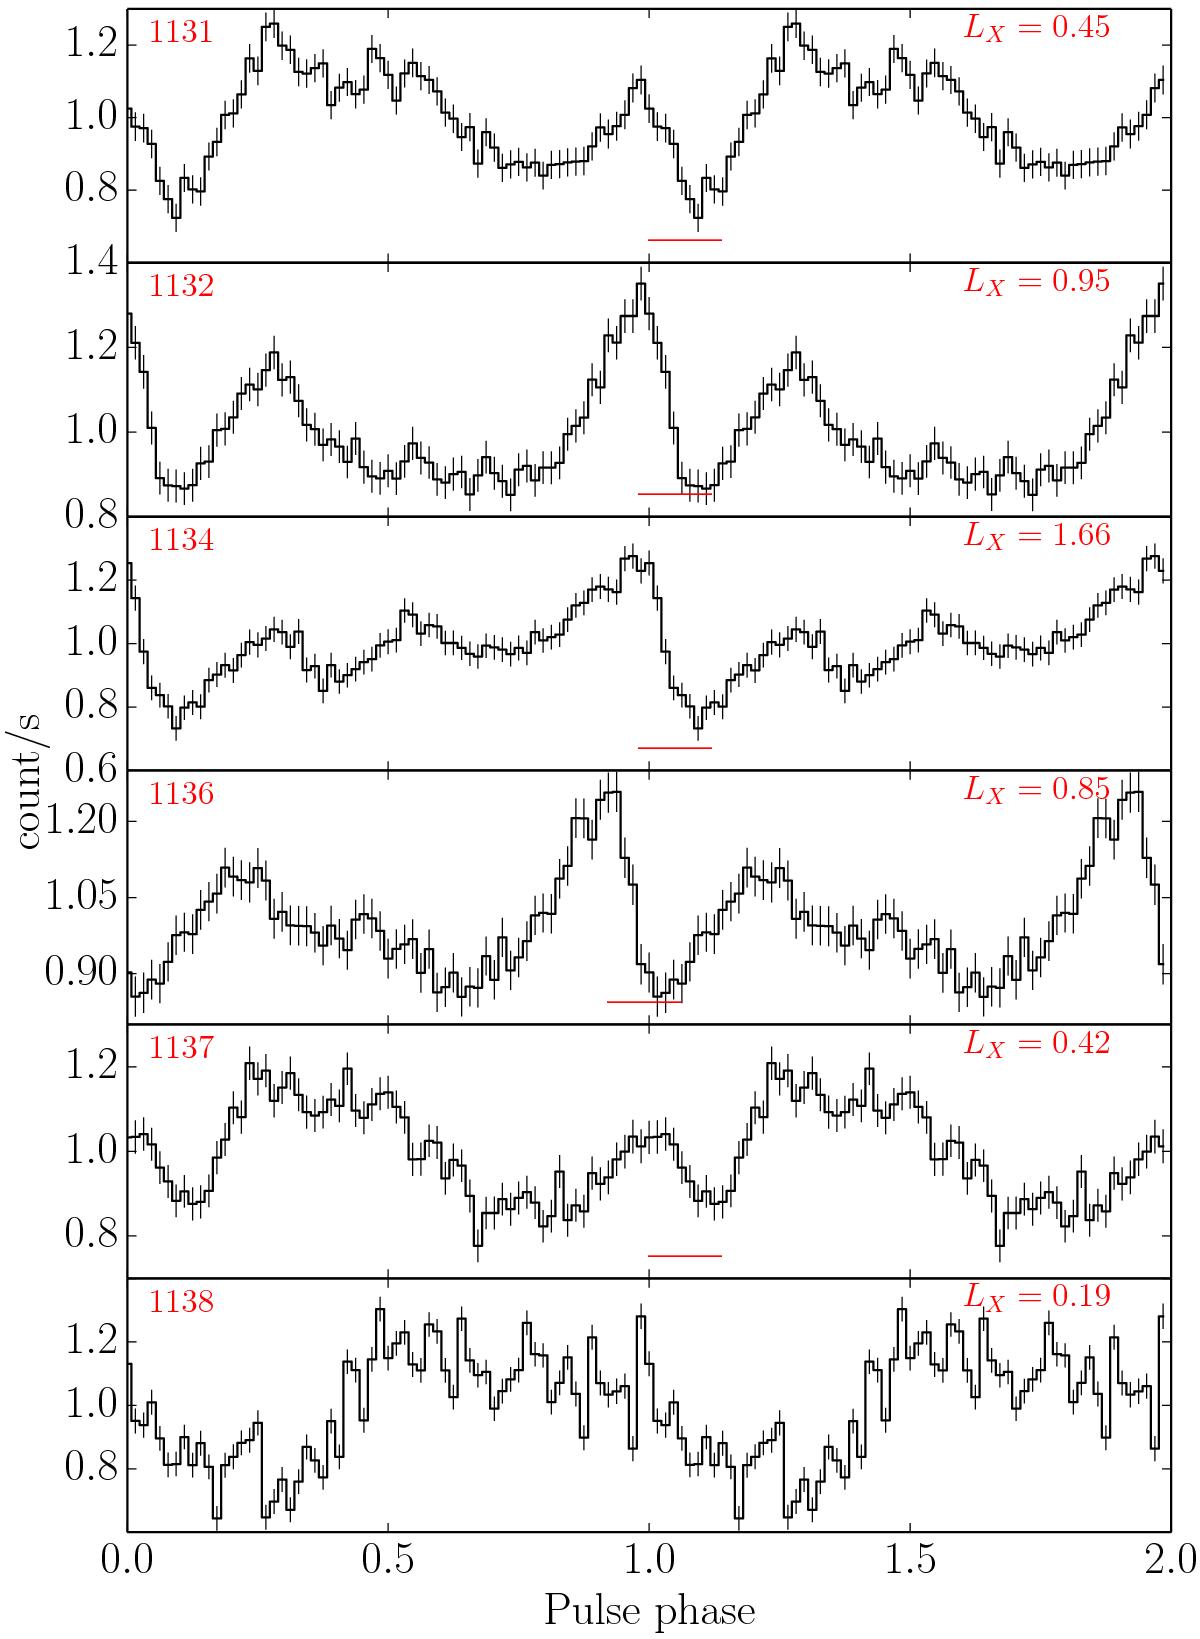
IBIS/ISGRI (18−80 keV) normalized pulse profiles obtained with the timing solution resulting from our phase-connection analysis. Each panel represents, from top to bottom, the successive INTEGRAL observations (from Rev# 1131 to 1138, shown in the top left corner). In the top right corner, the luminosity of the source (3−80 keV) in units of 1037 erg/s is reported. The thin straight line around phase 1.0 at the bottom of each panel (except Rev# 1138) approximately indicates the phase range where the sharp features used to phase-connect the observations are found.
Current usage metrics show cumulative count of Article Views (full-text article views including HTML views, PDF and ePub downloads, according to the available data) and Abstracts Views on Vision4Press platform.
Data correspond to usage on the plateform after 2015. The current usage metrics is available 48-96 hours after online publication and is updated daily on week days.
Initial download of the metrics may take a while.