Free Access
Fig. 11
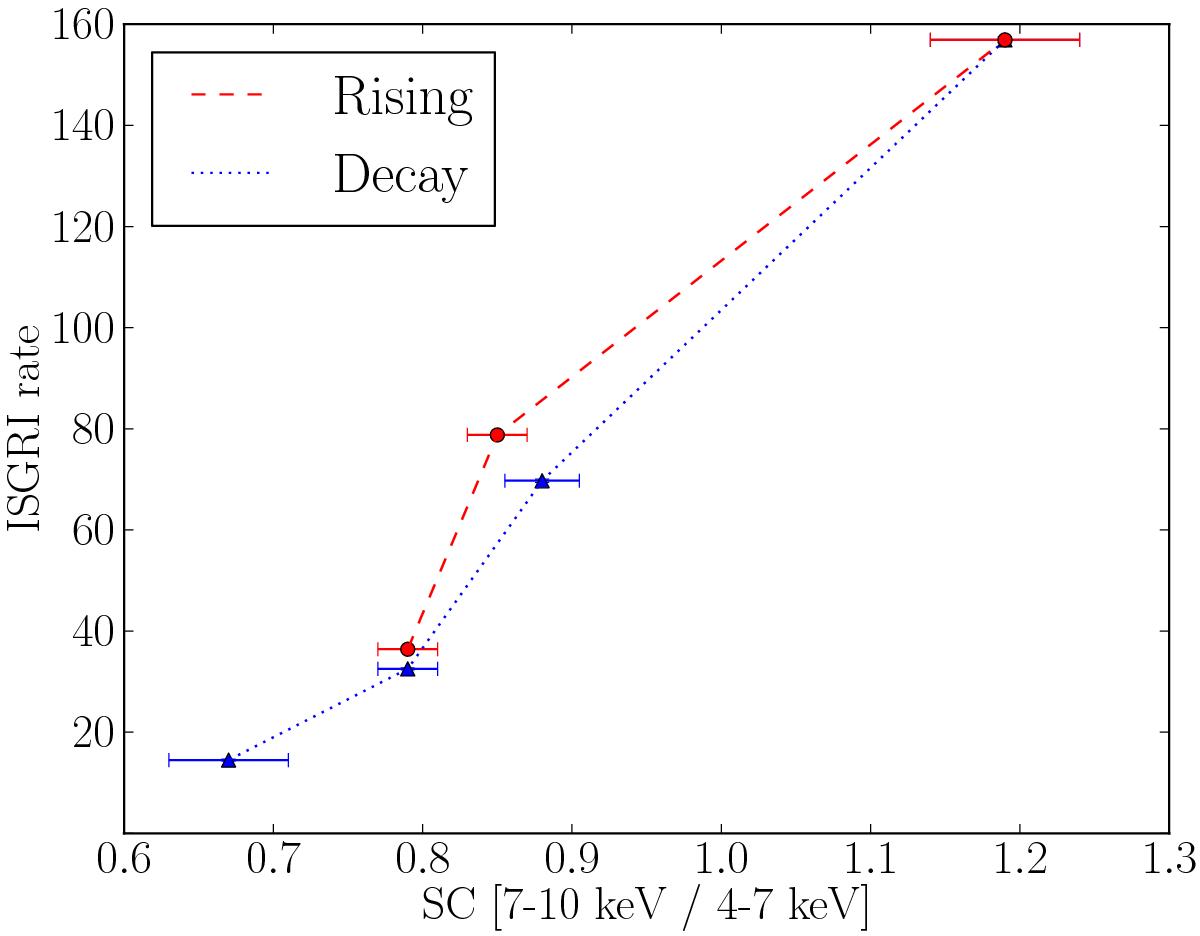
Hardness/intensity diagram for GX 304-1 during the analyzed outburst. The soft color definition is given in the text. The errors are 1σ uncertainties. The errors on the ISGRI rates are smaller than the symbol size. The dashed red curve corresponds to the rising part of the outburst, the dotted blue one – to the decay.
Current usage metrics show cumulative count of Article Views (full-text article views including HTML views, PDF and ePub downloads, according to the available data) and Abstracts Views on Vision4Press platform.
Data correspond to usage on the plateform after 2015. The current usage metrics is available 48-96 hours after online publication and is updated daily on week days.
Initial download of the metrics may take a while.