Fig. 10
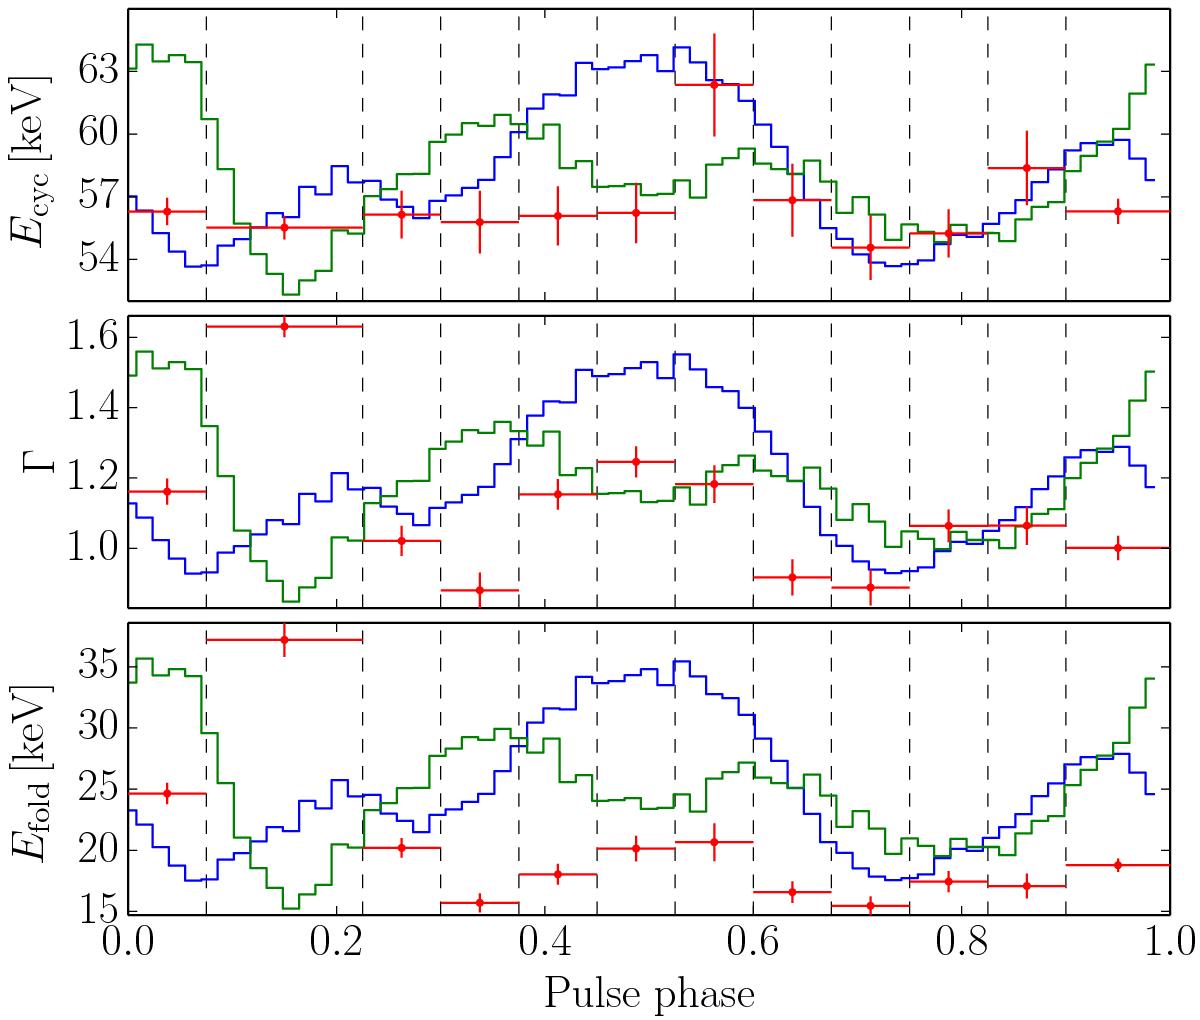
Best fit parameters of the phase-resolved spectra using the five stacked INTEGRAL observations. The vertical dashed lines indicate the phase-bins. The solid blue curve is the JEM-X average pulse profile, while the green curve is the ISGRI average pulse profile. The vertical error bars are 1σ uncertainties, while the horizontal bars represent the phase bin width.
Current usage metrics show cumulative count of Article Views (full-text article views including HTML views, PDF and ePub downloads, according to the available data) and Abstracts Views on Vision4Press platform.
Data correspond to usage on the plateform after 2015. The current usage metrics is available 48-96 hours after online publication and is updated daily on week days.
Initial download of the metrics may take a while.