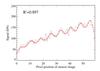
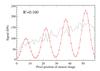
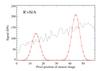
Fig. 5
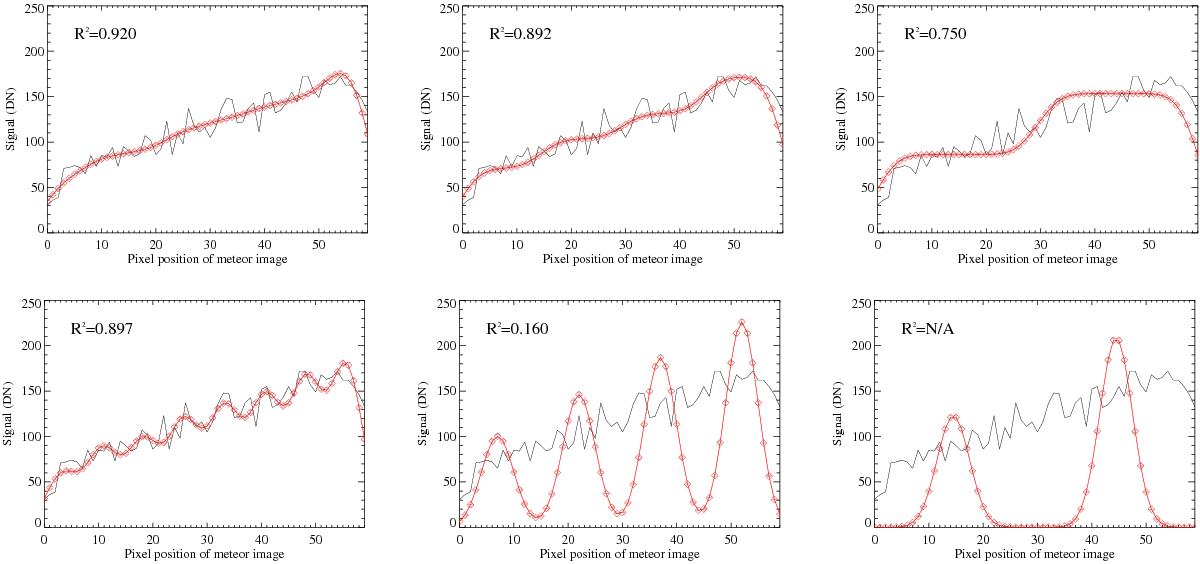
Fits to the image row segment of 110 pixels along the synthetic meteor in Fig. 2 for the model that evaluates formally the integrals in Eq. (A.5)(top) and for the approximation using function-time products (bottom). The flux of the meteor point source was sampled with n = 8 (left), n = 4 (middle) and n = 2 (right). Notation in this and the following figure is as in Fig. 4.
Current usage metrics show cumulative count of Article Views (full-text article views including HTML views, PDF and ePub downloads, according to the available data) and Abstracts Views on Vision4Press platform.
Data correspond to usage on the plateform after 2015. The current usage metrics is available 48-96 hours after online publication and is updated daily on week days.
Initial download of the metrics may take a while.