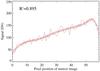
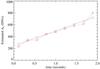
Fig. 4
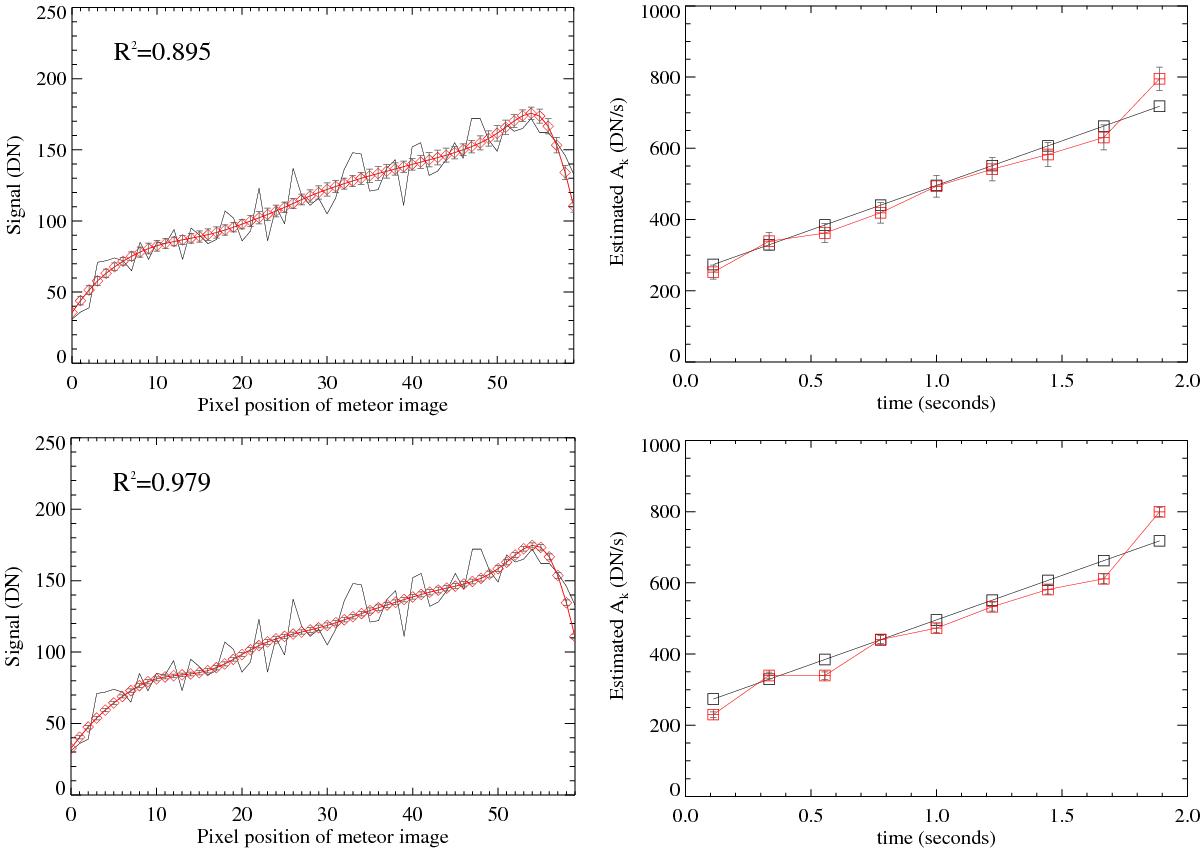
Results of fitting the model on the synthetic meteor in Fig. 2 using only the row of pixel measurements along the meteor trajectory (top) and an additional ten rows on either side (bottom). Left: synthetic measurements (black line) and their model estimates (red diamonds). Right: flux estimates (red squares) plotted against a priori values (black squares).
Current usage metrics show cumulative count of Article Views (full-text article views including HTML views, PDF and ePub downloads, according to the available data) and Abstracts Views on Vision4Press platform.
Data correspond to usage on the plateform after 2015. The current usage metrics is available 48-96 hours after online publication and is updated daily on week days.
Initial download of the metrics may take a while.